1. INTRODUCCIÓN
1. 1. Fructose intake
During the last five decades, there has been an exponential increase in the consumption of sugars, because of their ability to enhance the palatability of food. Among them, the high intake of free fructose appears particularly significant. The traditional sweetener, sucrose, a disaccharide containing one glucose and one fructose molecule joined together, has been replaced by high-fructose corn syrup (HFCS) as caloric sweetener in beverages and other foods (1, 2). High-fructose corn syrup was developed in the 1960s as a cheaper sweetener. It is produced from corn syrup through an enzymatic isomerisation process that converts some of its original glucose content into fructose. There are two main forms of HFCS commercialised: HFCS-42 and HFCS-55, which contain 42% and 55% fructose respectively (3, 4). However, studies have shown that the exact fructose load may vary among manufacturers, with a maximum of 65% of fructose content. This indicates that a higher than assumed fructose consumption may have been taking place unknowingly (5).
Added sugars consumption, especially in the form of calorically sweetened beverages, has been linked to an increased body weight (6, 7), reduced high-density lipoprotein (HDL) levels and augmented low-density lipoprotein (LDL) and triglyceride levels (7, 8), which are parameters known to increase the risk of cardiovascular diseases. This is why the World Health Organisation (WHO) recommends that the energy provided by the consumption of added sugars should not exceed 10% of the total energy in a diet (9).
1. 2. Pathologies related to fructose intake
Many studies have demonstrated that the increasing consumption of fructose is related to the epidemics of metabolic syndrome, type 2 diabetes and cardiovascular diseases (10, 11).
Metabolic syndrome has been defined by the WHO as a group of disorders, including abdominal obesity, insulin resistance, hypertension and hyperlipidaemia (12). The mechanisms that cause its onset are unknown, but it is believed to be a combination of environmental and genetic factors (13). Given that fructose reduces leptin production (1), satiety signals are bypassed and overconsumption, weight gain and insulin resistance are promoted (14). Moreover, fructose produces dyslipidaemia and an increase in visceral adipose volume (15).
Type 2 diabetes is characterised by insulin resistance, whereby the cells are unable to uptake circulating blood glucose. Countries with a high HFCS consumption present a 20% higher prevalence of type 2 diabetes, independently of Body Mass Index (BMI) or total sugar intake (16).
1. 3. Tagatose
Tagatose is a monosaccharide discovered by Dr Gilbert V. Levin, in his attempt to find a new sweetener (17). It fulfilled his aim, given that tagatose is 92% as sweet as sucrose and provides virtually no available energy (18). It has been approved for human consumption by the Food and Drug Administration (FDA) and the European Union (19, 20). Nevertheless, it has laxative properties at high doses, because only 20% of the intake is absorbed in the intestine. Tagatose passes into the lower intestine, where it produces an osmotic effect (18, 21, 22).
Tagatose can be synthesised by a chemical and enzymatic treatment of the lactose found in deproteinised whey, which is a waste product of the dairy industry. It can be also directly obtained from the galactose derived from lactose (22).
Tagatose has been proposed as an antidiabetic drug, as it controls post-prandial hyperglycaemia, hyperinsulinemia and HbA1C levels (20, 22, 23). Its consumption can also cause weight loss at a clinically desirable rate and has antioxidant and prebiotic properties (22); and unlike fructose, it does not cause elevations in plasma uric acid concentration (24).
1. 4. Structure of fructose, glucose and tagatose
Monosaccharides are crystalline solids that tend to have a sweet taste. They are made up by carbon chains of varying length with a ketone or an aldehyde group. The most representative monosaccharides are the hexoses, and among them, glucose and fructose, due to their free availability. They are found in fruits and honey. Tagatose, on the other hand, is referred to as a rare sugar, which means that it is a monosaccharide that rarely exist in nature. These three compounds have structural differences, as it is shown in Figure 1: glucose contains an aldehyde group, while fructose and tagatose present ketone groups in carbon 2. Fructose and tagatose are epimers at carbon 4 (2, 25, 26).

Figure 1. Structures of D-glucose, D-fructose and D-tagatose. The yellow boxes indicate the ketone or aldehyde group present in the molecules, while the green boxes refer to the spatial arrangement of substituents at stereogenic carbon 4 that differentiates both epimers, fructose and tagatose. Created with BioRender.com.
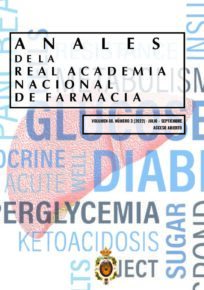
Due to the differences in their structure, these three monosaccharides undergo different metabolic pathways, shown in Figure 2.
Fructose is transported into the enterocytes through glucose transporter 5 (GLUT5), a process that is not dependent on either sodium cotransport or adenosine triphosphate (ATP). Then, it is released to the bloodstream through GLUT2 (1, 2, 28). Afterwards, fructose uptake into the liver cells mainly occurs through GLUT2 by a non-insulin dependent mechanism (1, 29). Fructose is preferentially sent to the liver, where it is phosphorylated through the action of an enzyme called fructokinase, yielding fructose-1-phosphate. This enzyme has a high affinity for fructose, so the reaction rate is high (30). As ATP is a required substrate for the phosphorylation, large quantities of AMP are produced, which in turn increase uric acid synthesis (2). Fructose-6-phosphate is then cleaved by aldolase B, producing glyceraldehyde and dihydroxyacetone phosphate (31). These trioses-phosphate can be converted into pyruvate and enter the tricarboxylic acid cycle, to finally obtain CO2 and H2O. Even so, part of the triose phosphates will result in lactate and glucose formation (via gluconeogenesis), which can be converted to glycogen (2, 14, 32). A fraction of the carbons of fructose become constituents of lipids, through a process called de novo lipogenesis (DNL) (33). It has been demonstrated that in fructose-fed rats, lactate is the substance with the highest lipogenic capacity (34).
Glucose is absorbed in the intestine by a sodium-glucose cotransporter (or sodium-glucose linked transporter, SGLT) (35). Once it reaches the liver, it can be degraded through glycolysis. In the first reaction of this pathway, glucose is phosphorylated to glucose-6-phosphate by the action of glucokinase. This enzyme has a low affinity for glucose, so its conversion depends on glucose concentrations (36). Then, glucose-6-phosphate is transformed into fructose-6-phosphate, which in the next step is converted into fructose-1,6-bisphosphate. This last reaction is catalysed by the enzyme phosphofructokinase, which is inhibited by ATP and citrate (37). Fructose-1,6-bisphosphate is also cleaved into glyceraldehyde-3-phosphate and dihydroxyacetone phosphate. Both, the strict regulation of phosphofructokinase and the low affinity of glucokinase for glucose allow a greater control of the speed at which glucose is degraded through glycolysis (2).
The metabolism of tagatose is identical to that of fructose, but it takes place at a slower speed. Tagatose is also transformed into tagatose-1-phosphate and it is cleaved by aldolase B into glyceraldehyde and dihydroxyacetone phosphate. This is the point at which glucose, tagatose and fructose metabolisms are connected. Tagatose-1-phosphate is an activator of glucokinase, so glucose is transformed into glucose-6-phosphate at a higher rate. The higher concentration of glucose-6-phosphate promotes the action of the hepatic glycogen synthase, and glycogenesis takes place. Moreover, tagatose-1-phosphate is an inhibitor of glycogen phosphorylase, so glucose remains stored as glycogen. These effects lead to a lower post-prandial glycaemia (22, 38).
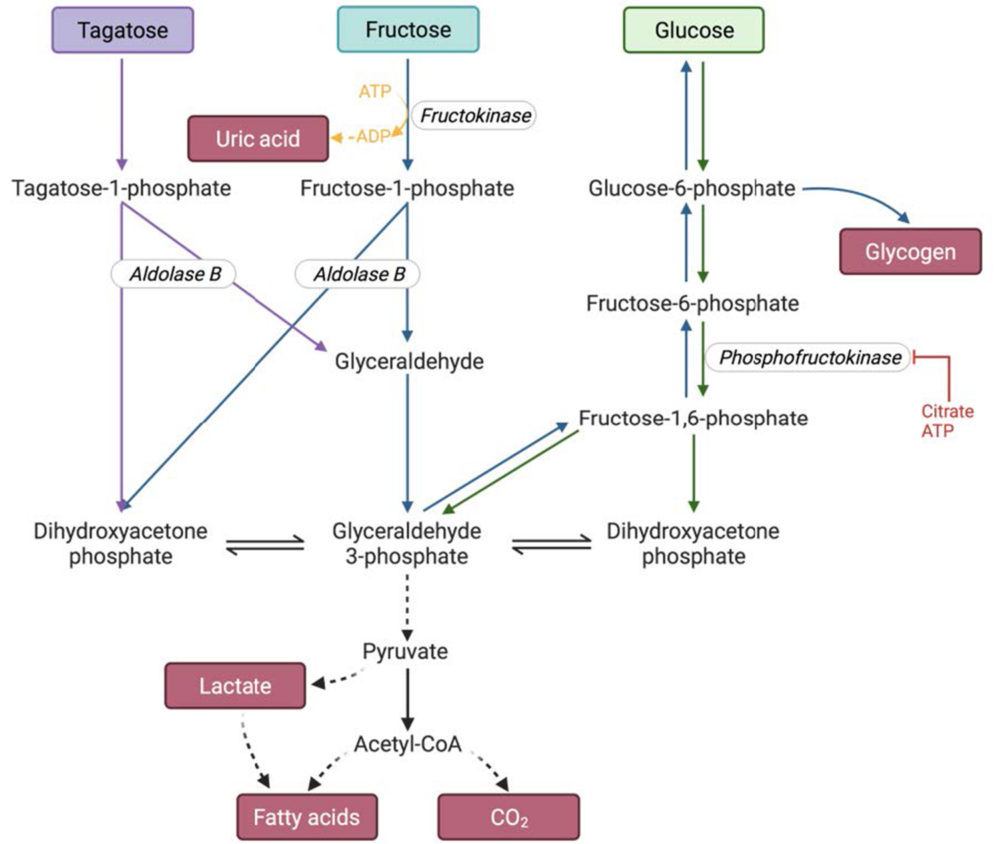
Figure 2. Glucose, fructose and tagatose metabolism. The colours correspond to the metabolism of one of the hexoses: blue-fructose, green-glucose and purple-tagatose. The blue arrows also indicate how glucose and glycogen are formed as a result of fructose metabolism. The enzymes are represented in italics. Created with BioRender.com.
1.5.Cholesterol metabolism
Cholesterol and lipid esters, like triacylglycerols, are hydrophobic molecules, but they need to be transported in blood to the tissues where they will be stored or consumed. For that purpose, there are some particles called lipoproteins, that act as lipid carriers. They form complexes through the non-covalent association of lipids to apoproteins. Lipoproteins are water soluble particles with a hydrophobic core and a polar surface. There are several types of lipoproteins, depending on their densities and functions (39, 40):
- Chylomicrons: they carry mainly triacylglycerols from the diet and transport them from the intestine to other tissues. These lipoproteins are the largest in size, and the ones with the lowest density.
- Very-low-density lipoprotein (VLDL): they transport all the lipids that have been synthesised in the liver (mainly triglycerides) to the other tissues (i.e., muscle and adipose tissue). VLDL is higher in density than chylomicrons. The microsomal triglyceride transfer protein (MTTP) plays a central role in the assembly of VLDL.
- Low-density lipoproteins (LDL): they contain primarily cholesterol and cholesteryl esters. These molecules are transported to extrahepatic tissues. LDL uptake by the tissues is mediated through the specific interaction of its apoB protein with the LDL receptor (LDLR) present in the cell membrane. After this interaction, LDL reaches the cytosol of the cells through an endocytosis mediated mechanism.
- High-density lipoproteins (HDL): they are responsible for the reverse cholesterol transport (RCT), as they carry cholesterol and cholesteryl esters from extrahepatic tissues to the liver. HDL uptake by the liver occurs via the Scavenger receptor class B type 1 (SR-B1) receptor.
These lipoproteins work together to transport the lipids throughout the body, as can be seen in Figure 3.
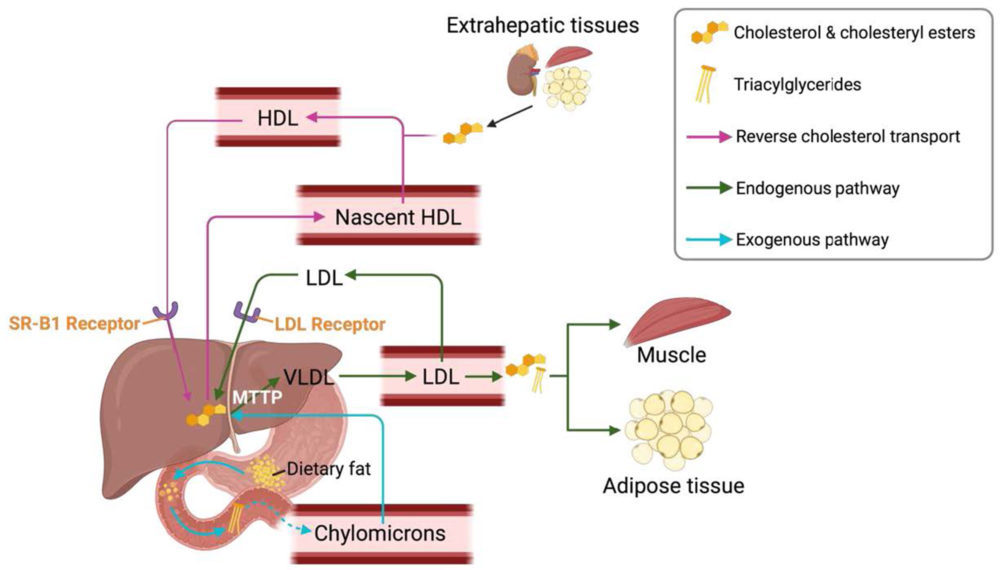
Figure 3. Lipoproteins and lipid transport. Created with BioRender.com
1.6.Foetal programming
Foetal programming postulates that there is programming during the embryogenic and foetal stage that induces permanent changes in the adult. These modifications can be structural, physiological and metabolic and they will increase the risk of individuals to develop various diseases (41).
The programming can be performed through epigenetics: the nutritional conditions and the environment of the mother during the gestation can vary the expression of some genes. Also, imprinted genes are differentially expressed depending on the sex of the individual (42).
Some studies have already shown the deleterious effect that fructose consumption during gestation can produce in the progeny: dyslipidaemia (43), lipids oxidative stress (44), modified leptin signalling (45) and impaired hippocampal function (46). Moreover, the outcome can be gender-dependent, as it is shown in a study (47) that demonstrated that cholesterol levels varied depending on the sex of the animal.
2. OBJECTIVES
The objectives of the present work are:
- To study whether fructose intake by pregnant rats during gestation has any effect on cholesterol metabolism of the male offspring.
- To determine whether fructose (or tagatose) and fructose plus cholesterol intake by male descendant rats produces any variation in their cholesterol metabolism and, in this case, to study whether these changes are affected by the maternal diet.
3. MATERIALS AND METHODS
3.1.Experimental design
The experiment was approved by the Ethics Committee. The experimental design was carried out as follows:
First, female and male Sprague-Dawley rats were mated. Once gestation was confirmed, female pregnant rats were provided with a standard diet, and they were separated in two groups according to the drink they received throughout gestation. The fructose group received a 10% fructose solution (w/v), while the control group was provided with tap water. Then, after parturition, the litter was standardised to nine rats and both, the mother and the offspring drank water. The lactation finished at day 21, and only the male rats were kept until three months of age. They received a standard diet and water without any supplement. Once they reached 3 months of age, male rats were also separated into various groups, depending on the diet:
- Control group: they consumed water without additives and a standard diet.
- Fructose group: they received a 10% fructose solution (w/v) and a standard diet.
- Tagatose group: they consumed a 10% tagatose solution (w/v) and a standard diet.
- Fructose plus cholesterol group: they were given a 10% fructose solution (w/v) and a standard diet supplemented with 2% cholesterol.
In total, since the maternal treatment was also taken into account, there were 8 experimental groups of male rats, which are shown in Figure 4. After the 21 days of diet, the rats were sacrificed. Their blood was collected in EDTA-K2 tubes, which was centrifuged to separate the plasma. Also, their livers were weighted. Both plasma and livers were frozen at – 80 0C for their later use.

Figure 4. Experimental Design. Created with BioRender.com
3.2.Biochemical parameter assays
3.2.a. Total plasma cholesterol determination
It was performed with an enzymatic colorimetric end-point assay, using a Spinreact (Spain) kit.
3.2.b. Plasma triglycerides determination
It was performed with an enzymatic colorimetric end-point assay, using a Spinreact (Spain) kit.
3.2.c. HDL cholesterol determination
The objective was the determination of High-density Lipoprotein (HDL) cholesterol levels. For this purpose, a two-step process was carried out:
3.2.c.a. Precipitation of non-HDL cholesterol lipoproteins
Phosphotungstic acid, in combination with magnesium chloride, is able to precipitate apo B containing lipoproteins (chylomicrons, VLDL and Low-density Lipoproteins (LDL)). The kit used was from Spinreact, Spain. The volumes employed were 100μL of sample and 10μL HDLc-P (the precipitating reagent). After a 10-minute incubation at room temperature, the samples were centrifuged at 12,000rpm for 30 minutes at room temperature. The supernatant was used for subsequent HDL-cholesterol levels determination.
3.2.c.b. HDL cholesterol determination
The determination of HDL cholesterol levels was performed with an enzymatic colorimetric end-point assay, using a Spinreact (Spain) kit. It is based on the detection at 505nm of a coloured compound (quinoneimine), that is generated from cholesterol after sequential enzymatic reactions. The calculation of non-HDL cholesterol was obtained from the difference of total cholesterol concentration minus HDL cholesterol concentration.
3.2.d. Coronary Risk Index (CRI)
The CRI is calculated from total cholesterol and HDL-cholesterol data. The formula is:
𝑇𝑜𝑡𝑎𝑙 𝑐ℎ𝑜𝑙𝑒𝑠𝑡𝑒𝑟𝑜𝑙
𝐶𝑅𝐼=
𝐻𝐷𝐿 𝑐ℎ𝑜𝑙𝑒𝑠𝑡𝑒𝑟𝑜𝑙
3.2.e. Atherogenic Index of Plasma (AIP)
The AIP is calculated from triglyceride and HDL-cholesterol data. The formula is:
𝑇𝑟𝑖𝑔𝑙𝑦𝑐𝑒𝑟𝑖𝑑𝑒𝑠
API= log
𝐻𝐷𝐿 𝑐ℎ𝑜𝑙𝑒𝑠𝑡𝑒𝑟𝑜𝑙
3.3.Molecular parameters assays
3.3.a. RNA Extraction
The Ambion® RiboPureTM kit was used to isolate ribonucleic acid (RNA) from liver tissues. For this purpose, 100mg of liver tissue were obtained and were later homogenised in the presence of TRI Reagent® with the TissueLyser®. TRI Reagent® contains both phenol and guanidine thiocyanate, which lyse the cells and inactivate nucleases in order to prevent nucleic acid degradation. Then, this mixture was centrifuged to separate all the insoluble components. The supernatant was collected and bromochloropropane (BCP) was added. BCP produces the formation of two phases: aqueous phase and organic phase. RNA will stay in the aqueous phase, while desoxyribonucleic acid (DNA) and proteins remain in the interphase or the organic phase. The aqueous phase was subsequently introduced in a series of columns to purify and extract the RNA, which was later quantified in the Nanodrop®. Then, an agarose gel electrophoresis was performed to verify the integrity of RNA (Figure 5).
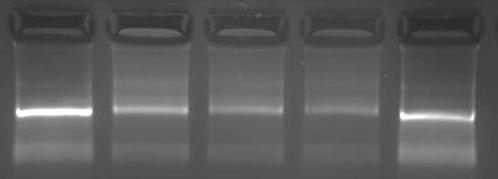
Figure 5. Agarose gel electrophoresis of RNA extraction. The two more visible bands correspond to the 28S and 18S ribosomal RNA.
To ensure the total elimination of DNA from the sample, the Ambion® TURBO DNA-freeTM kit was employed. This kit contains deoxyribonucleases (DNases) that degrade the DNA present. Then, as a way to confirm that any contamination of DNA had been removed, a polymerase chain reaction (PCR) using RPS29 (ribosomal protein S29) primers, and the subsequent agarose gel electrophoresis were performed. The outcome was as expected: only the positive control showed a nitid result and no bands appeared in the samples containing RNA treated with DNase, confirming the absence of DNA contaminant.
3.3.b. Reverse Transcription-PCR (RT-PCR)
After the purification step with DNase, the sample only contained RNA. In order to quantify the amount of messenger RNA (mRNA) in the samples through real time PCR, it is previously required to convert the mRNA into complementary DNA (cDNA). With this aim, a reverse transcriptase polymerase chain reaction (RT-PCR) was carried out using the SuperScriptTM II Reverse Transcriptase (InvitrogenTM, USA). After this procedure, both a normal PCR and an agarose gel electrophoresis (Figure 6) were performed to ensure that the cDNA obtained was functional. This PCR was done with primers that bind to a housekeeping gene sequence, the ribosomal protein S29 (RPS29) gene. As shown in Figure 6, all cDNA samples correctly amplified the product of RPS29 gene, confirming the functionality of the cDNA that had been obtained.
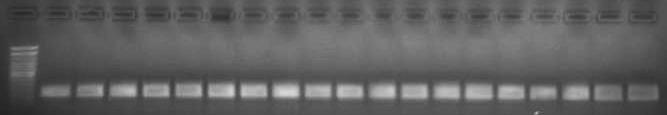
Figure 6. Agarose gel electrophoresis of RT-PCR.
3.3.c. Real-Time Polymerase Chain Reaction (Real-Time PCR)
3.3.c.a. Basic principles of the method
The real-time PCR is a technique that allows the quantification of the DNA present in a sample due to the detection of fluorescent particles that bind specifically to the double stranded DNA (dsDNA) (Figure 7). The measurement of fluorescent intensity is performed after each cycle of PCR, because, as it is the point at which more dsDNA is present, the signal will be greater. The fluorophore used was SYBR Green I, which binds preferentially to dsDNA.
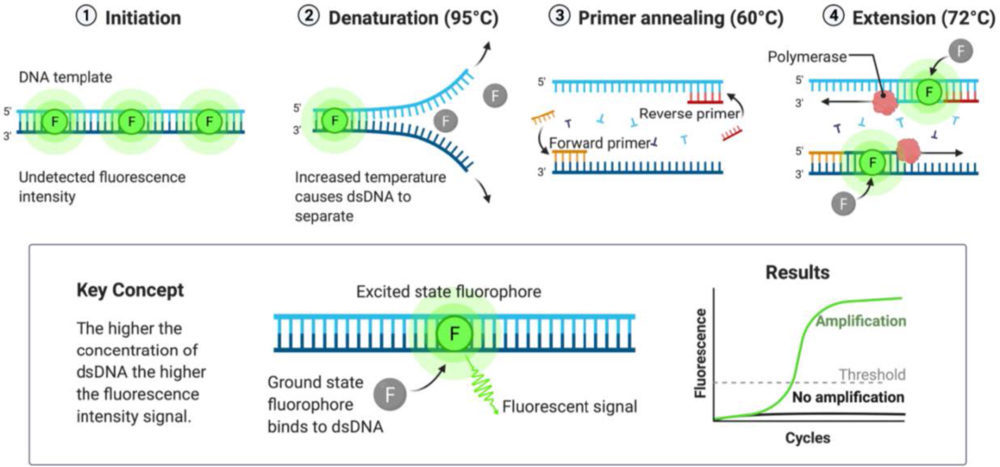
Figure 7. Scheme of the mechanism of the Real-Time PCR. The fluorophore (SYBR Green I) is only able to emit fluorescence in the excited state, i.e., when bound to double stranded DNA (dsDNA). Created with BioRender.com
The rate at which DNA is generated is not linear and there are four stages in its production, according to the intensity of fluorescence detected (48):
- Baseline: the initial amount of dsDNA is minimal, and the fluorescence intensity is too low to be detected.
- Exponential: when the detection threshold has been overpassed, the intensity changes exponentially. The cycle at which the fluorescence is detected and starts raising exponentially is called Crossing Point (Cp). This parameter is inversely proportional to the initial quantity of DNA. Thus, the lower the DNA amount, the higher the number of cycles required to get the signal detected, resulting in a higher Cp value.
- Linear: the reaction rate decreases because there are not enough DNA polymerase molecules to grow all the DNA strands already produced.
- Plateau: the DNA polymerase is saturated, so the signal is maintained constant, resulting in a plateau region.
The initial amount of cDNA can be quantified using a calibration line. To create it, serial 1/10 dilutions of a standard sample with a known DNA concentration were prepared and their Cp obtained. Then, the cDNA concentration of the samples is obtained by the interpolation of their Cp value in the calibration line.
Table 1. Sequence of the primers used for the cDNA amplification.
3. 3.c.b. SYBR Green I Real-Time PCR Protocol
The CFX96 Touch Real-Time PCR Detection System (Bio-Rad, USA) was used to perform this assay. For each sample, the following volumes were added: 1μL forward primer (10μM), 1μL reverse primer (10μM), 10μL SYBR green Premix Ex Taq (Takara Bio Inc., Japan), 6μL deionised water and 2μL sample. The information regarding the primers used in the present work can be found in Table 1.

An agarose gel electrophoresis was performed after each real time-PCR experiment to verify that the amplicon obtained matched the expected result (Figures 8 and 9).

Figure 8. Agarose gel electrophoresis of Real Time-PCR of MTTP.
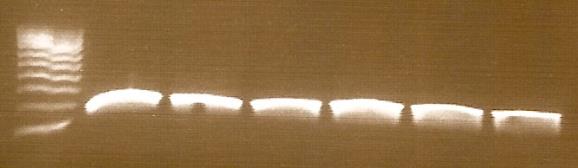
Figure 9. Agarose gel electrophoresis of Real Time-PCR of LDLR.
3.4. Statistical analysis
The assays were carried out with samples from 7 animals per group, except for group Control-Control, which had 8 animals. Results were expressed as means ± standard error (SE) and they were analysed by two-way ANOVA (Analysis of Variance). If the differences were statistically significant (p<0.05), they were analysed through a posteriori Bonferroni correction to identify the variance significance. There were two factors analysed:
- The effect of fructose intake during gestation by the mothers (M) on the male offspring. Statistically significant differences between Control Mothers vs. Fructose Mothers will be indicated with a hash (#), and in case the difference is almost statistically significant, it will be indicated with an ampersand (&).
- The effect of the diets received by the male offspring at 3 months of age (D). The differences between treatments within the same mother will be indicated with an asterisk (*).
The value of eta squared (η2) determines the proportion of the variance that is attributed to the mother (M), the diet (D) or the interaction between both parameters (M*D).
All the statistical determinations were performed with the program SPSS.
4. RESULTS AND DISCUSSION
To facilitate the comprehension of the findings regarding the diet provided to the male offspring, the results will be grouped into two studies:
- Study I. Effect of Fructose consumption versus (vs.) Tagatose.
This analysis will allow to determine if the observed effects are fructose specific. - Study II. Effect of Fructose consumption alone vs. Fructose plus Cholesterol.
In addition, the effect of maternal feeding during gestation (water or fructose) on the cholesterol metabolism of their offspring will be analysed within each group.
4.1.Study I. Effect of Fructose consumption vs. Tagatose
4.1.a. Plasma total cholesterol and triglycerides levels
The results of the two-way ANOVA are presented in Table 2. Regarding total cholesterol concentration, the changes observed seem to be due to the different diets received by the male offspring, although the difference is not statistically significant (p=0.097). On the other hand, both the maternal treatment (M) and the diet (D) seem to affect triglycerides levels, but these differences did not reach statistical significance (p=0.054 and p=0.094 respectively).
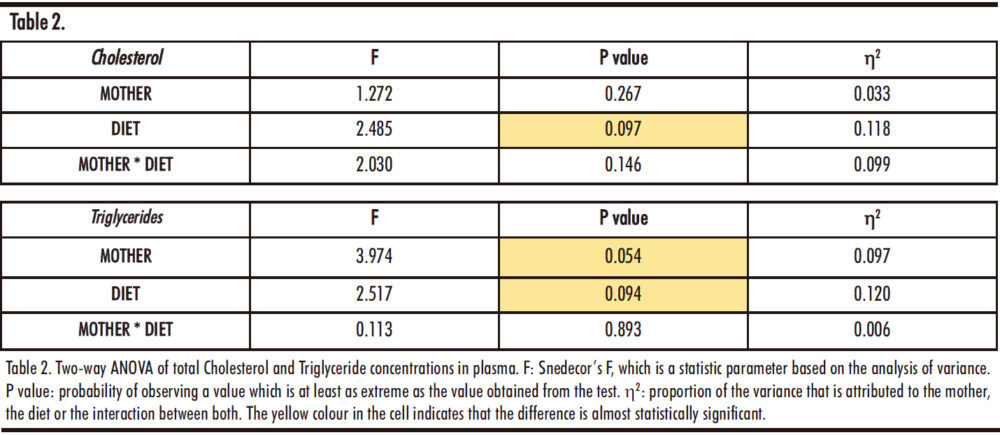
Thus, Figure 10 shows the data after a posteriori Bonferroni correction.
The total cholesterol concentration in the offspring of control mothers shows statistically significant differences between the control and fructose groups when compared to the tagatose group. This would indicate that tagatose, and not fructose, produces a marked increase in total cholesterol levels. However, when studying the descendants of fructose supplemented mothers, we can observe that there are no variations between the groups, which suggests that this effect disappears with fructose consumption during gestation. As indicated in Figure 10 with a hash (#), cholesterol levels in tagatose supplemented descendants from control mothers are significantly higher than those of tagatose supplemented descendants from fructose mothers.
On the other hand, there is a tendency to increase the plasma triglycerides levels in those groups of descendants receiving any carbohydrate (fructose or tagatose) versus descendants that consumed water. Moreover, this trend was observed regardless of the diet of the mothers.
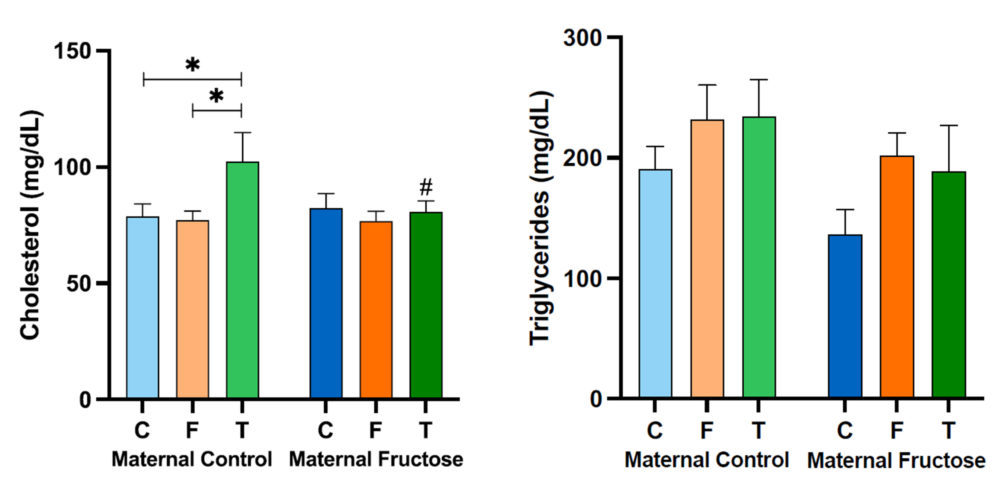
Figure 10. Plasma total cholesterol and triglycerides levels in the male progeny, after 21 days of receiving different treatments (blue bar: water–C, orange bar: fructose–F, green bar: tagatose–T). The bars that present a lighter colour correspond to the descendants of mothers that were given water during gestation (maternal control group), and the bars with a darker colour, to the descendants of mothers that drank a fructose solution during gestation (maternal fructose group). The data presented are means ± standard error (SE). The symbol * indicates statistically significant differences between diets, and the # between maternal intake.
4. 1.b. HDL cholesterol and non-HDL cholesterol concentration in plasma
To further study if there was an effect in cholesterol metabolism due to fructose or tagatose intake, HDL cholesterol and non-HDL cholesterol levels were determined. As shown in Table 3, there are no significant differences in the HDL cholesterol that could be attributed to the diet, the mothers or the sum of both factors. However, regarding non-HDL cholesterol, both the consumption of the mothers (M) during the gestation and the diets (D) that the male offspring received, showed almost statistically significant differences (M, p=0.087; D, p=0.064).

After performing the Bonferroni test, as it can be seen in Figure 11, no statistically significant differences are found in the HDL cholesterol. Nevertheless, there is a tendency of higher HDL cholesterol levels in the group of males from control mothers that drank the tagatose solution versus those drinking water and fructose. However, the effect was not observed in the descendants of fructose supplemented mothers. Curiously, there is an almost statistically significant decrease in HDL cholesterol levels (p=0.086, denoted with a & symbol in Figure 11), of tagatose supplemented descendants from fructose-mothers when compared with the descendants of control-mothers. This decrease would be a non-desirable effect, since HDL is known as “good” cholesterol, suggesting a lower protection against cardiovascular diseases. Interestingly, in descendants from fructose fed mothers, a trend to decrease in HDL-cholesterol was found in males receiving both fructose and tagatose in comparison to males drinking water.
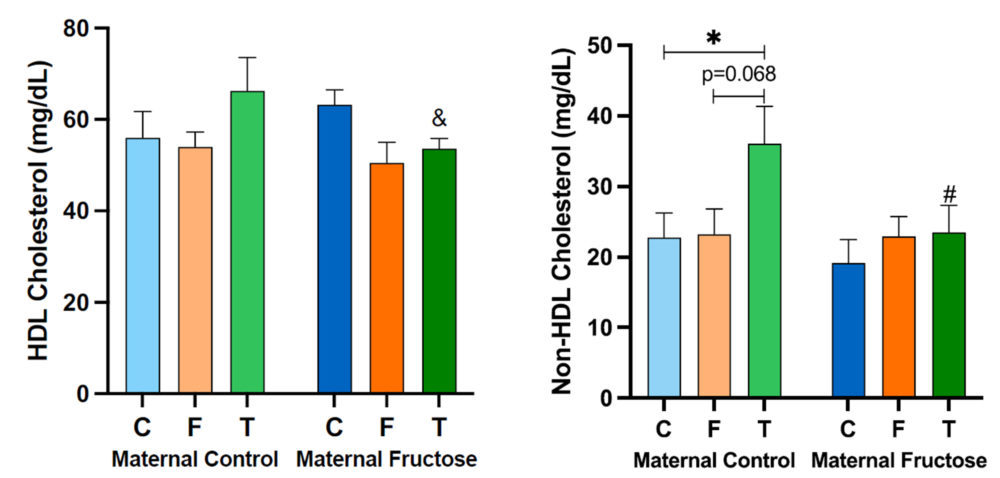
Figure 11. Plasma HDL cholesterol and non-HDL cholesterol concentration in the male progeny, after 21 days of receiving different treatments (blue bar: water–C, orange bar: fructose–F, green bar:tagatose–T). The bars that present a lighter colour correspond to the descendants of mothers that were given water during gestation (maternal control group), and the bars with a darker colour, to the descendants of mothers that drank a fructose solution during gestation (maternal fructose group). The data presented are means ± standard error (SE). The symbol * denotes statistically significant differences between diets, and the # between maternal intake. The symbol (&) corresponds to differences that are almost statistically significant between maternal intake.
Regarding the non-HDL cholesterol concentration, the treatment received by the males in the maternal control group does produce statistically significant differences, especially between the ones that drank water and those supplemented with tagatose, showing this last group higher non-HDL cholesterol levels. Curiously, this tagatose-induced effect was, again, not observed in descendants of fructose-mothers and this observation was coincident to that one found for total cholesterol levels (Figure 10).
4.1.c. Hepatic MTTP, LDLR and SR-B1 expression
Both the MTTP, LDLR and SR-B1 are genes coding for molecules involved in cholesterol metabolism.
After performing the two-way ANOVA with the expression data for the three genes, there is only one statistically significant difference (Table 4): in the expression of MTTP gene, for the influence of the diet (D) received by the male rats (p=0.013). However, almost statistically significant differences were found in the expression of LDLR due to both the maternal treatment (M) and the diet (D) and in SRB1 expression due to the interaction between both treatments (M*D) (LDLR: p=0.097, M; p=0.090, D; SR-B1: p=0.052, M*D).
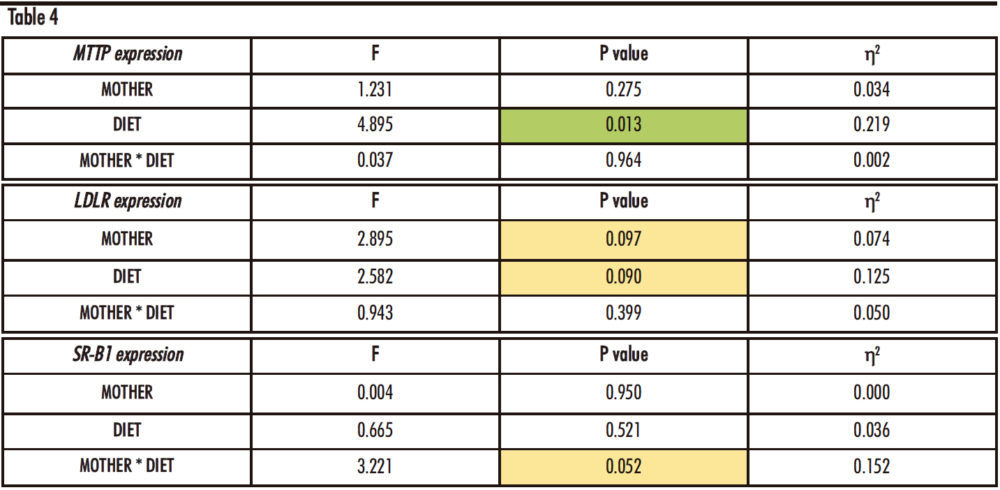
Table 4. Two-way ANOVA of hepatic MTTP, LDLR and SR-B1 expression. F: Snedecor’s F, which is a statistic parameter based on the analysis of variance. P value: probability of observing a value which is at least as extreme as the value obtained from the test. η²: proportion of the variance that is attributed to the mother, the diet or the interaction between both. The green colour in the cell indicates that the difference is statistically significant, while yellow represents that the difference is almost statistically significant.
These possible statistical differences were further studied through a posteriori Bonferroni test, and they can be seen in Figure 12.

The hepatic expression of MTTP shows a tendency to increase in males that consumed fructose in both groups of descendants, those from control mothers and fructose-mothers. This trend is almost statistically significant versus the descendants drinking water in the control maternal group, which would mean that the consumption of fructose increases the expression of MTTP. Given that this gene is involved in the production of non-HDL cholesterol, one would expect a higher concentration of this parameter in males consuming fructose than in those drinking only water. However, this effect cannot be seen in Figure 11 (non-HDL). Nevertheless, since MTTP protein also participates in the assembly of TG-rich lipoproteins to be released by the hepatocyte, it is logical to find a similar trend to increase in plasma TG of males receiving fructose (Figure 10).
On the other hand, hepatic LDLR gene expression tends to increase after consuming tagatose in descendants of control mothers, becoming almost significant in comparison to males consuming fructose (p=0.075). Moreover, as it was also observed for total cholesterol, HDL cholesterol and non-HDL cholesterol levels (Figures 10 and 11) the consumption of fructose by the mothers has a dampening action in the effect of tagatose on gene expression. Consequently, an almost statistically significant difference between the two groups of tagatose supplemented rats was observed (denoted by a & symbol in Figure 12, LDLR). This result does not explain the findings observed in plasma non-HDL cholesterol, as an increase in the expression of LDLR would mean that more LDL cholesterol would be taken by the liver and diminished non-HDL cholesterol levels would be found in blood. In contrast, plasma non-HDL cholesterol concentration turned out to be more elevated in males consuming tagatose in comparison to the other two groups.
Lastly, the profile of the hepatic gene expression of SR-B1 varies among the offspring from the two maternal groups. On one hand, the effect of carbohydrate’s intake in the expression of SR-B1 in descendants from control-mothers shows a decreasing tendency when compared to the rats receiving water. However, in descendants of fructose-fed mothers, this trend is the opposite, i.e., the expression seems to be induced by the intake of carbohydrates. On the other hand, there is a statistically significant decrease in the expression of SR-B1 between control rats from fructose fed mothers versus those from control mothers. As SR-B1 codes for a protein involved in the liver uptake of HDL cholesterol, opposite tendencies should be seen in the plasma HDL concentration (Figure 11), and remarkably we can confirm that this is the case.
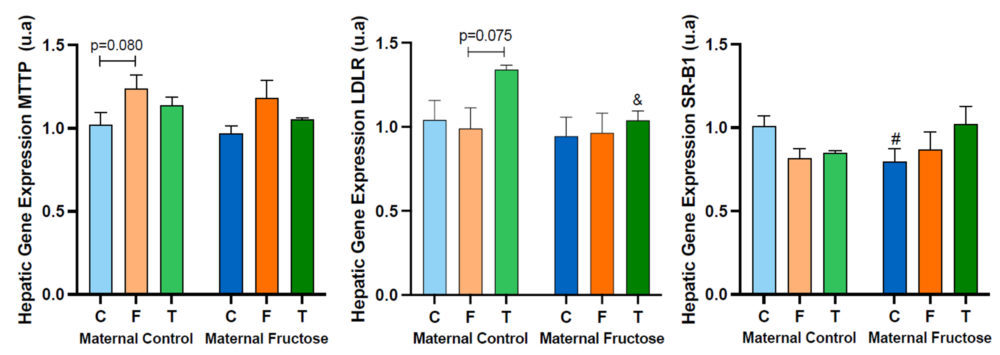
Figure 12. MTTP, LDLR and SR-B1 hepatic gene expression in the male progeny, after 21 days of receiving different treatments (blue bar: water–C, orange bar: fructose–F, green bar: tagatose–T). The bars that present a lighter colour correspond to the descendants of mothers that were given water during gestation (maternal control roup), and the bars with a darker colour, to the descendants of mothers that drank a fructose solution during gestation (maternal fructose group). The data presented are means ± standard error (SE). The symbol # corresponds to differences that are statistically significant between maternal consumption, and the symbol & to differences that are almost statistically significant between maternal intake.
4.1.d. Coronary Risk Index (CRI) and Atherogenic Index of Plasma (AIP)
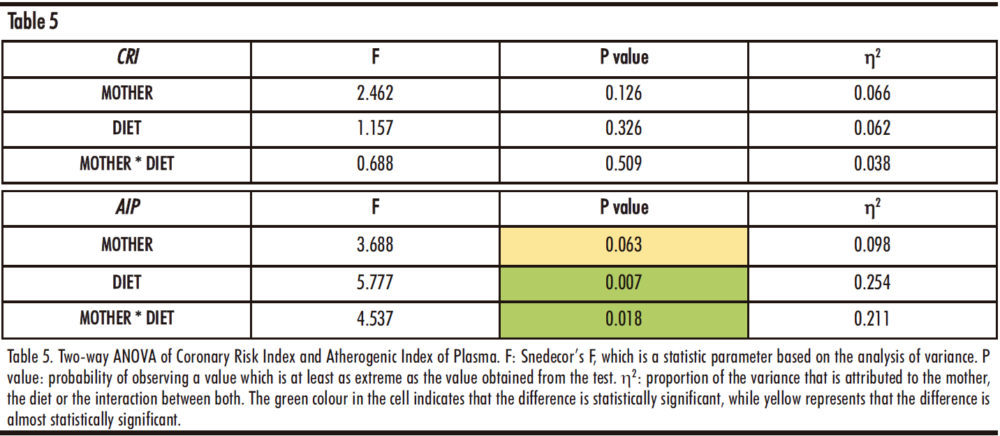
Table 5 shows the result of performing a two-way ANOVA test on the Coronary Risk Index (CRI) and the Atherogenic Index of Plasma (AIP). As can be seen, there are only statistically significant differences in the AIP, for the factor of the diet (D) received by the male progeny (p=0.007) and the interaction between the two studied factors (diet and maternal feeding, M*D) (p=0.018).
As can be seen in Figure 13, there are no significant differences in the Coronary Risk Index when comparing all the groups. On the other hand, the Atherogenic Index of Plasma varies greatly among the groups. Firstly, there is a marked decrease in the males that drank water from fructose fed mothers versus those rats from control mothers. As AIP is a predictor of the risk for the development of cardiovascular diseases, this would indicate that maternal fructose supplementation would have a protective effect. If we look at the HDL cholesterol (Figure 11) and triglycerides plasma levels (Figure 10), this decrease in AIP observed in the rats receiving water from fructose fed mothers is due to a lower triglycerides concentration and a slightly higher HDL cholesterol concentration compared to the males consuming water from control mothers. In addition, there are statistical differences among diet treatments in the fructose maternal group, indicating that fructose or tagatose intake in the offspring from fructose-fed mothers would have a greater tendency to undergo a cardiovascular event.
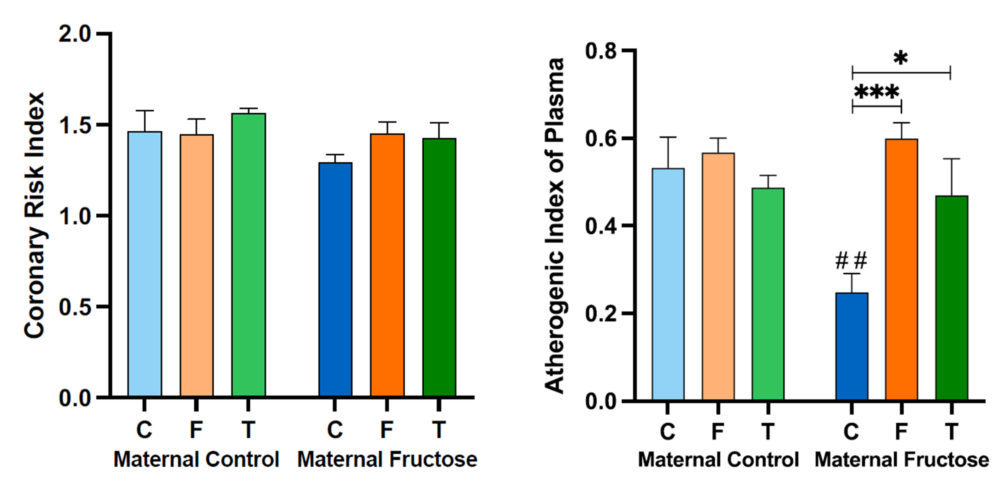
Figure 13. Coronary Risk Index and Atherogenic Index of Plasma obtained after calculation of with data from the samples obtained after 21 days of receiving different treatments (blue bar: water–C, orange bar: fructose–F, green bar: tagatose–T). The bars that present a lighter colour correspond to the descendants of mothers that were given water during gestation (maternal control group), and the bars with a darker colour, to the descendants of mothers that drank a fructose solution during gestation (maternal fructose group). The data presented are means ± standard error (SE). The symbol * represents statistically significant differences between diets, and the # between maternal intakes.
4.2.Study II: Effect of Fructose consumption alone vs. Fructose plus Cholesterol
4.2.a. Plasma total cholesterol and triglycerides levels
As can be seen in Table 6, the factor diet (D) produces statistically significant differences for both total cholesterol and triglycerides concentration, p=0.000 and p=0.043 respectively.
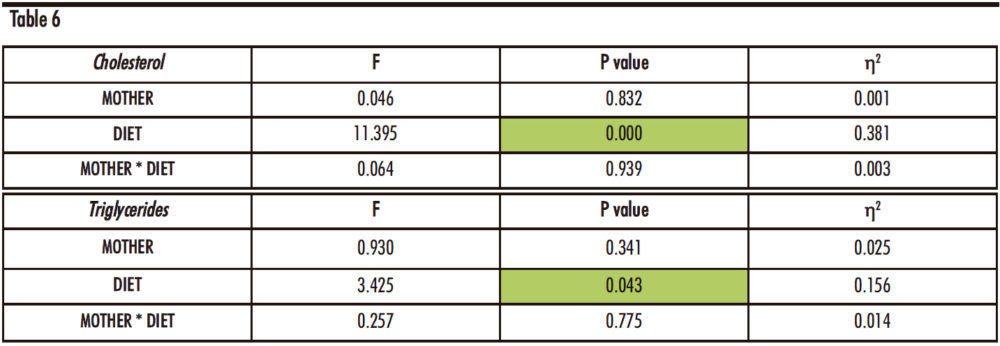
Table 6. Two-way ANOVA of Cholesterol and Triglyceride concentrations in plasma. F: Snedecor’s F, which is a statistic parameter based on the analysis of variance. P value: probability of observing a value which is at least as extreme as the value obtained from the test. η²: proportion of the variance that is attributed to the mother, the diet or the interaction between both. The green colour in the cell indicates that the difference is statistically significant.
Thus, Figure 14, exhibits the data of plasma total cholesterol and triglycerides concentration of the male offspring.
The cholesterol concentration shows a marked increase in the males fed a fructose solution and a cholesterol-rich diet (FCh) when compared to the other dietary treatments (water or only fructose). This augmentation is statistically significant in both, descendants from control mothers and fructose-fed mothers. This result demonstrates that the addition of cholesterol to the fructose-rich diet causes, as expected, higher cholesterol levels in blood.
Regarding plasma triglycerides concentration, there is also a trend to an increase in the FCh group when compared to the C and F groups in descendants from both groups of mothers, reaching almost statistical significance only for descendants from fructose-fed mothers (p=0.076).
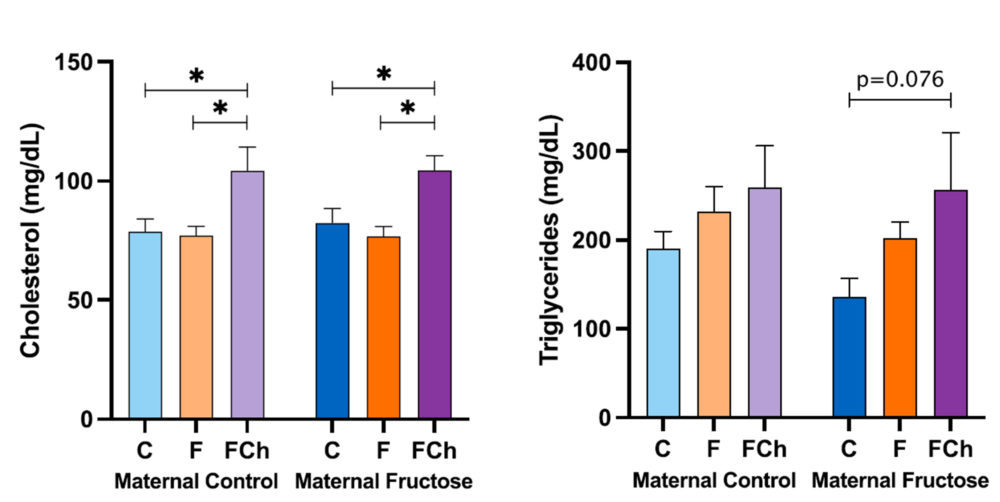
Figure 14. Plasma total cholesterol and triglycerides concentration in the male progeny, after 21 days of receiving different treatments (blue bar: water–C, orange bar: fructose–F, purple bar: fructose + cholesterol-rich diet–FCh). The bars that present a lighter colour correspond to the descendants of mothers that were given water during gestation (maternal control group), and the bars with a darker colour, to the descendants of mothers that drank a fructose solution during gestation (maternal fructose group). The data presented are means ± standard error (SE). The symbol * denotes statistically significant differences between diets.
4.2.b. Plasma HDL cholesterol and non-HDL cholesterol concentration
As Table 7 indicates, there are statistically significant differences regarding the diet (D) of the male offspring for both HDL cholesterol and non-HDL cholesterol concentrations.
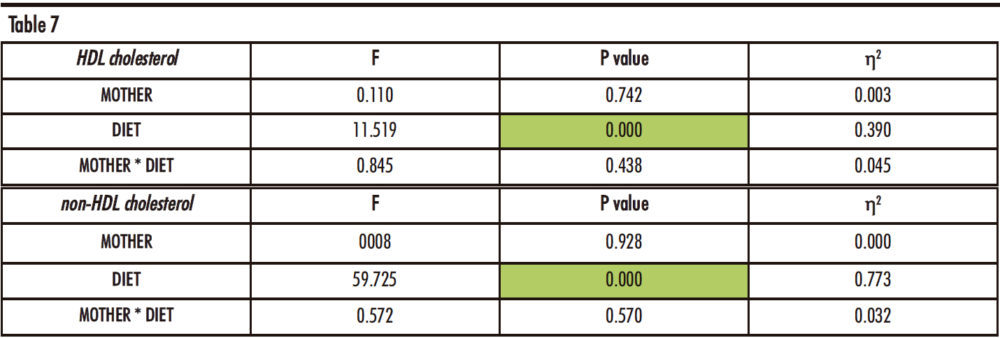
Table 7. Two-way ANOVA of plasma HDL and non-HDL cholesterol. F: Snedecor’s F, which is a statistic parameter based on analysis of the variance. P value: probability of observing a value which is at least as extreme as the value obtained from the test. η²: proportion of the variance that is attributed to the mother, the diet or the interaction between both. The green colour in the cell indicates that the difference is statistically significant.
After performing a posteriori Bonferroni correction, the data of HDL cholesterol and non-HDL cholesterol concentrations can be seen in Figure 15.
The HDL cholesterol concentration shows significant decrease in the group supplemented with fructose and cholesterol (FCh) versus the group that drank water (C), regardless of the maternal intake. Since fructose alone already produced a tendency to a decrease in HDL-cholesterol in males from fructose-fed mothers (but not in the offspring from control mothers) (Figure 11), the diminution observed in the males receiving fructose plus cholesterol became almost significant versus the males drinking fructose alone only in descendants from control mothers (p=0.059).
Interestingly, the trend found in the non-HDL cholesterol concentration is the opposite than the one found for HDL cholesterol, being significantly much higher in the FCh group than in the other two groups (C and F), regardless of the maternal diet.
These results, taken together with those shown in Figure 14, indicate that the distribution of HDL and non-HDL cholesterol levels deeply varies in the FCh group: this group of animals presents elevated plasma non-HDL cholesterol and lower HDL cholesterol concentrations in comparison to the other two groups, with also a higher total cholesterol concentration. This would indicate that a higher cholesterol intake by these rats produces an excess of cholesterol that is distributed in lipoproteins such as VLDL, chylomicrons and LDL.
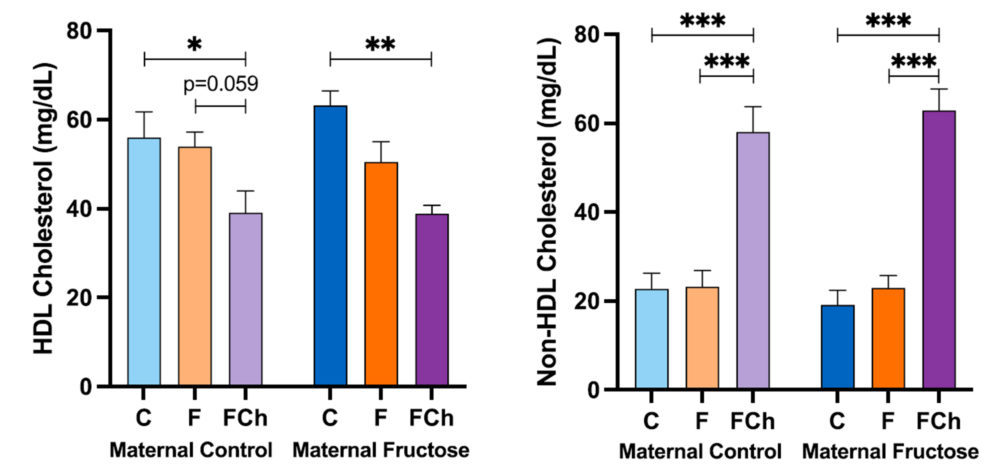
Figure 15. Plasma HDL cholesterol and non-HDL cholesterol concentration in the male progeny, after 21 days of receiving different treatments (blue bar: water–C, orange bar: fructose–F, purple bar: fructose + cholesterol-rich diet–FCh). The bars that present a lighter colour correspond to the descendants of mothers that were given water during gestation (maternal control group), and the bars with a darker colour, to the descendants of mothers that drank a fructose solution during gestation (maternal fructose group). The data presented are means ± standard error (SE). The symbol * denotes statistically significant differences between diets.
4.2.c. Hepatic MTTP, LDLR and SR-B1 expression
The Table 8 shows statistically significant differences in the expression of MTTP and LDLR genes with regards to the diet of the male offspring (p=0.015 and p=0.035, respectively). In the case of SR-B1, this difference is almost significant (p=0.082).
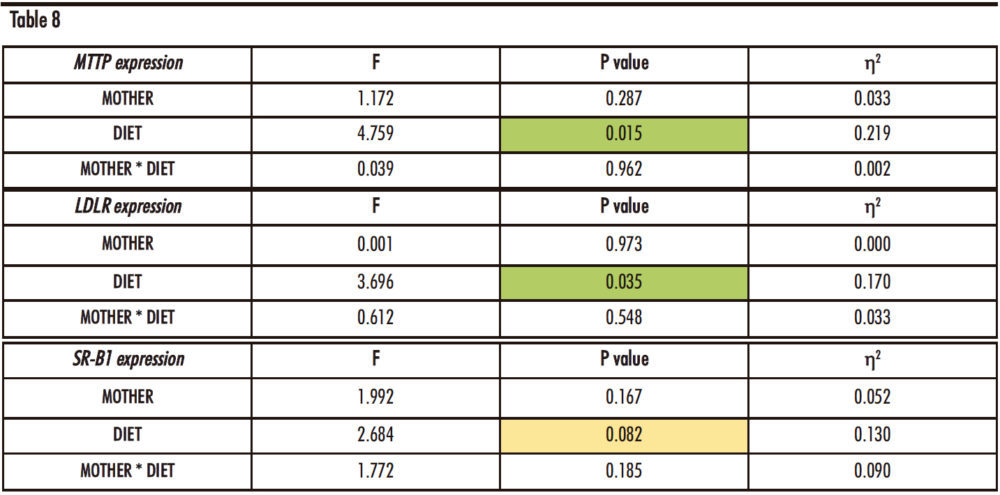
Table 8. Two-way ANOVA of hepatic MTTP, LDLR and SR-B1 expression. F: Snedecor’s F, which is a statistic parameter based on the analysis of variance. P value: probability of observing a value which is at least as extreme as the value obtained from the test. η²: proportion of the variance that is attributed to the mother, the diet or the interaction between both. The green colour in the cell indicates that the difference is statistically significant, while yellow represents that the difference is almost statistically significant.
Thus, Figure 16 shows the hepatic gene expression of MTTP, LDLR and SR-B1.
Regarding the MTTP hepatic expression, the trend to an increase already commented for descendants receiving fructose alone (Figure 12) was also found in the offspring taking fructose plus cholesterol with respect to the control groups, regardless the maternal intake. Given that the product of this gene is related to the assembly of lipoproteins containing cholesterol and triglycerides, the expression of this gene in the FCh group is increased in accordance with total cholesterol concentration, triglycerides levels and especially the non-HDL cholesterol concentration in plasma.
The gene expression of hepatic LDLR exhibits a decreasing trend for the FCh group, the effect being significantly different versus males drinking only water when they come from control-mothers.
As the LDLR gene is associated with the uptake of non-HDL cholesterol from the blood into the liver, this result would correlate with the higher concentration of non-HDL cholesterol found in this group (Figure 15).
In addition, the SR-B1 gene expression also shows a slight decreasing trend between the control and FCh group in descendants from control mothers, but not in offspring from fructose-fed mothers.
Curiously, this trend had been already observed for males receiving fructose alone.
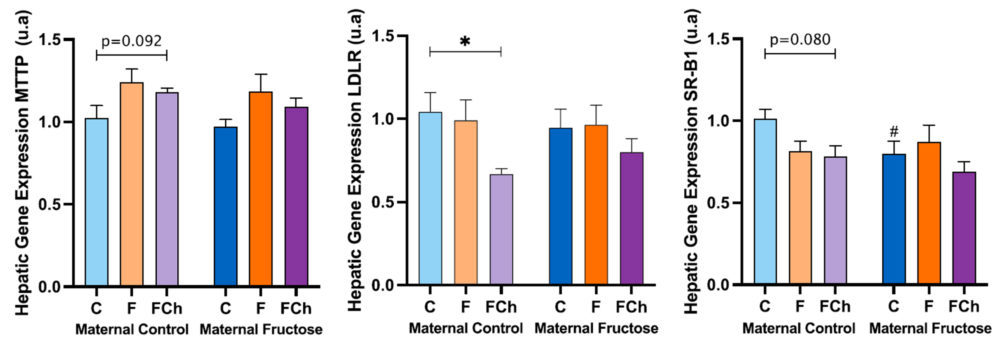
Figure 16. MTTP, LDLR and SR-B1 hepatic gene expression in the male progeny, after 21 days of receiving different treatments (blue bar: water–C, orange bar: fructose–F, purple bar: fructose + cholesterol-rich diet–FCh). The bars that present a lighter colour correspond to the descendants of mothers that were given water during gestation (maternal control group), and the bars with a darker colour, to the descendants of mothers that drank a fructose solution during gestation (maternal fructose group). The data presented are means ± standard error (SE). The symbol # represents statistically significant differences between maternal intakes.
4.2.d. Coronary Risk Index (CRI) and Atherogenic Index of Plasma (AIP)
Table 9 indicates differences regarding the diet (D) for both indexes (p=0.000 for both) and also regarding the interaction of the diet of the male progeny and the maternal feeding for the Atherogenic Index of Plasma.
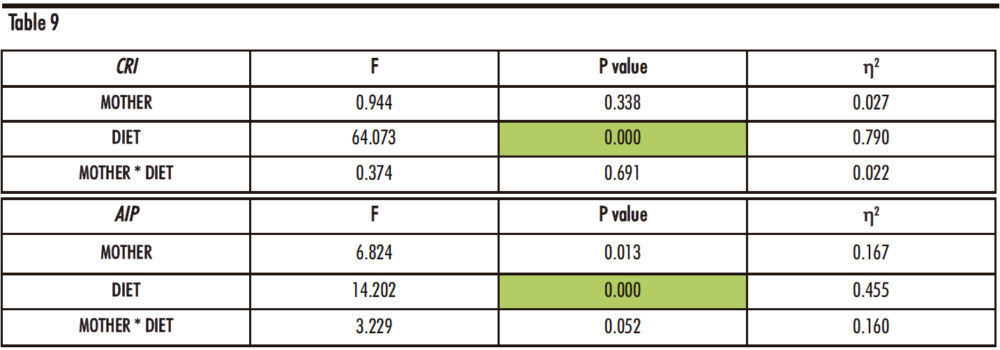
Table 9. Two-way ANOVA of Coronary Risk Index and Atherogenic Index of Plasma. F: Snedecor’s F, which is a statistic parameter based on the analysis of variance. P value: probability of observing a value which is at least as extreme as the value obtained from the test. η²: proportion of the variance that is attributed to the mother, the diet or the interaction between both. The green colour in the cell indicates that the difference is statistically significant.
As shown in Figure 17, in the Coronary Risk Index, there are statistically significant differences between the FCh group and the other two groups: control and fructose, independently of maternal intake.
Regarding the Atherogenic Index of Plasma, the same increase was found, being the difference statistically significant versus the other two groups only in the progeny from control mothers. Curiously, in descendants from fructose-fed mothers, fructose plus cholesterol intake was able to produce a significant increase with respect to the control group as that one observed with fructose intake.
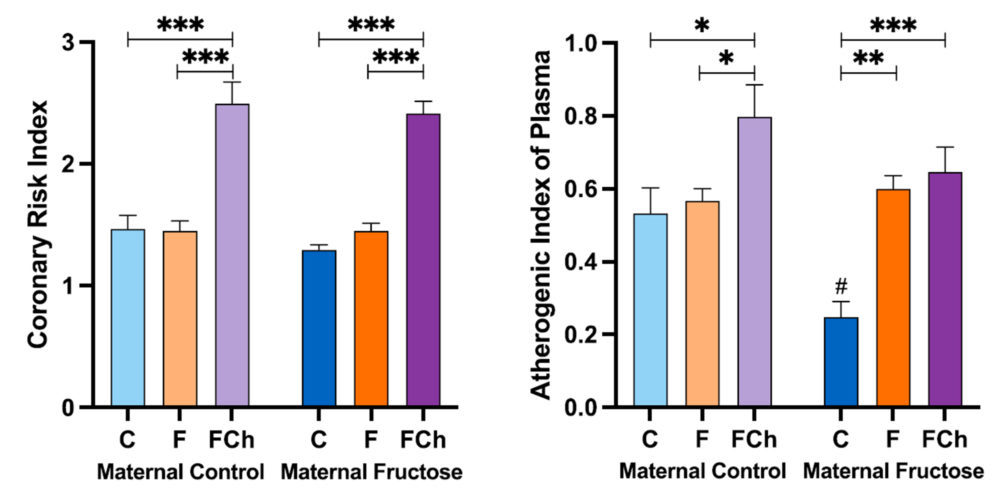
Figure 17. Coronary Risk Index and Atherogenic Index of Plasma obtained after calculation of with data from the samples obtained after 21 days of receiving different treatments (blue bar: water–C, orange bar: fructose–F, purple bar: fructose + cholesterol-rich diet–FCh). The bars that present a lighter colour correspond to the descendants of mothers that were given water during gestation (maternal control group), and the bars with a darker colour, to the descendants of mothers that drank a fructose solution during gestation (maternal fructose group). The data presented are means ± standard error (SE). The symbol * denotes statistically significant differences between diets, and the # between maternal intakes.
6. CONCLUSIONS
The conclusions of the present study are:
- In the offspring of mothers that drank water during gestation, tagatose intake increases plasma non-HDL cholesterol and total cholesterol concentrations. This effect is attenuated in the progeny of fructose fed mothers, which would indicate a foetal programming effect.
- In the offspring from fructose-fed mothers, fructose and tagatose intake tends to cause a decrease in plasma HDL cholesterol and an increase in triglycerides concentration, leading to a marked rise in the atherogenic ratio versus the control group. These findings suggest that both fructose and tagatose intake can lead to a higher risk of cardiovascular diseases in animals subjected to foetal programming induced by previous maternal fructose feeding.
- The combination of a fructose solution plus a cholesterol-rich diet results in an increase in total plasma cholesterol concentration, which corresponds to a huge rise in non-HDL levels and a decrease in HDL concentration, regardless the maternal intake. This effect caused by fructose and cholesterol intake would be detrimental to the animals, since atherogenic indices are increased, and they will be more likely to undergo cardiovascular disease.
- The increased hepatic expression of MTTP found in both, the F and FCh group would indicate a higher assembly of cholesterol and triglycerides containing lipoproteins, which correlates with the increased values of plasma total cholesterol, non-HDL cholesterol and triglycerides found in these rats.
- The decreased hepatic expression of LDLR observed in the FCh group would suggest a lower uptake of non-HDL lipoproteins leading to the higher plasma non-HDL cholesterol concentration observed in these animals.
Altogether, this study demonstrates that maternal intake of fructose clearly affects cholesterol metabolism in the progeny leading to a foetal programming effect. Furthermore, the dietary treatment of the progeny with fructose alone or combined with cholesterol and tagatose also negatively affects cholesterol metabolism increasing their atherogenic indices. These results demonstrate the deleterious effects of both, a high carbohydrate and cholesterol intake in the development of cardiovascular diseases. We would like to emphasize the key role of pharmacists advising the patients to reduce the consumption of diets rich in carbohydrates and cholesterol to prevent the further development of cardiovascular diseases.
7. CONFLICTS OF INTEREST
The Authors declare that there is no conflict of interest, and they accept all the rules and conditions of this Contest.
8. ACKNOWLEDGEMENTS
The authors thank Jose M. Garrido and his team for their help in handling the rats. This work was supported by grants from the Ministerio de Ciencia e Innovación (MICINN) (SAF2017-89537-R and PID2020-118054RB-I00) and European Union FEDER funds. Elena Fauste was supported with a FPU fellowship from MICINN.
9. BIBLIOGRAPHY
- Bray GA, Nielsen SJ, Popkin BM (2004) Consumption of high-fructose corn syrup in beverages may play a role in the epidemic of obesity. American Journal of Clinical Nutrition 79:537–543.
- Tappy L, Le KA (2010) Metabolic effects of fructose and the worldwide increase in obesity. Physiological Reviews 90:23–46.
- White JS, Hobbs LJ, Fernandez S (2015) Fructose content and composition of commercial HFCS-sweetened carbonated beverages. International Journal of Obesity 39:176–182.
- Lustig RH, Schmidt LA, Brindis CD (2012) Public health: The toxic truth about sugar. Nature 482:27–29
- Ventura EE, Davis JN, Goran MI (2011) Sugar content of popular sweetened beverages based on objective laboratory analysis: Focus on fructose content. Obesity 19:868–874
- Morenga L te, Mallard S, Mann J (2013) Dietary sugars and body weight: Systematic review and meta-analyses of randomised controlled trials and cohort studies. BMJ (Online) 345:e7492-undefined
- Welsh JA, Sharma A, Cunningham SA, Vos MB (2011) Consumption of added sugars and indicators of cardiovascular disease risk among US adolescents. Circulation 123:249–257
- Stanhope KL, Medici V, Bremer AA, Lee V, Lam HD, Nunez M v., Chen GX, Keim NL, Havel PJ (2015) A dose-response study of consuming high-fructose corn syrup-sweetened beverages on lipid/lipoprotein risk factors for cardiovascular disease in young adults. American Journal of Clinical Nutrition 101:1144–1154
- Nishida C, Uauy R, Kumanyika S, Shetty P (2004) The Joint WHO/FAO Expert Consultation on diet, nutrition and the prevention of chronic diseases: process, product and policy implications. Public Health Nutrition 7:245–250
- Johnson RJ, Segal MS, Sautin Y, Nakagawa T, Feig DI, Kang DH, Gersch MS, Benner S, Sánchez-Lozada LG (2007) Potential role of sugar (fructose) in the epidemic of hypertension, obesity and the metabolic syndrome, diabetes, kidney disease, and cardiovascular disease1-3. American Journal of Clinical Nutrition 86:899–906
- Stanhope KL, Schwarz JM, Havel PJ (2013) Adverse metabolic effects of dietary fructose: Results from the recent epidemiological, clinical, and mechanistic studies. Current Opinion in Lipidology 24:198–206
- Saklayen MG (2018) The Global Epidemic of the Metabolic Syndrome. Current Hypertension Reports 20:12–12.
- Aydin S, Aksoy A, Aydin S, Kalayci M, Yilmaz M, Kuloglu T, Citil C, Catak Z (2014) Today’s and yesterday’s of pathophysiology: Biochemistry of metabolic syndrome and animal models. Nutrition 30:1–9.
- Angelopoulos TJ, Lowndes J, Zukley L, Melanson KJ, Nguyen V, Huffman A, Rippe JM (2009) The effect of high-fructose corn syrup consumption on triglycerides and uric acid. Journal of Nutrition 139:1242–1245.
- Stanhope KL, Schwarz JM, Keim NL, et al (2009) Consuming fructose-sweetened, not glucose-sweetened, beverages increases visceral adiposity and lipids and decreases insulin sensitivity in overweight/obese humans. Journal of Clinical Investigation 119:1322–1334.
- Goran MI, Ulijaszek SJ, Ventura EE (2013) High fructose corn syrup and diabetes prevalence: A global perspective. Global Public Health 8:55–64.
- NASA (2004) A Natural Way to Stay Sweet.
- Levin G v., Zehner LR, Saunders JP, Beadle JR (1995) Sugar substitutes: Their energy values, bulk characteristics, and potential health benefits. In: American Journal of Clinical Nutrition. pp 1161–1168
- Food Ingredients First (2005) The European Union approves Tagatose as “novel food ingredient.”
- Levin G v. (2002) Tagatose, the new GRAS sweetener and health product. Journal of Medicinal Food 5:23–36.
- Saunders JP, Zehner LR, Levin G v. (1999) Disposition of D-[U- 14C]tagatose in the rat. Regulatory Toxicology and Pharmacology 29:46–56.
- Lu Y, Levin G v., Donner TW (2008) Tagatose, a new antidiabetic and obesity control drug. Diabetes, Obesity and Metabolism 10:109–134.
- Braunstein CR, Noronha JC, Khan TA, Mejia SB, Wolever TM, Josse RG, Kendall CW, Sievenpiper JL (2020) Effect of fructose and its epimers on postprandial carbohydrate metabolism: A systematic review and meta-analysis. Clinical Nutrition 39:3308–3318.
- Saunders JP, Donner TW, Sadler JH, Levin G v., Makris NG (1999) Effects of acute and repeated oral doses of D-tagatose on plasma uric acid in normal and diabetic humans. Regulatory Toxicology and Pharmacology 29:57–65.
- Granström TB, Takata G, Tokuda M, Izumori K (2004) Izumoring: A novel and complete strategy for bioproduction of rare sugars. Journal of Bioscience and Bioengineering 97:89–94.
- Nelson DL, Cox MM (2013) Carbohydrates and Glycobiology. In: Principles of Biochemistry, 6th ed. W. H. Freeman and Company, New York, pp 244-undefined.
- Cheeseman CI (1993) GLUT2 is the transporter for fructose across the rat intestinal basolateral membrane. Gastroenterology 105:1050–1056.
- Bray GA (2008) Fructose: Should we worry? International Journal of Obesity 32:S127–S131.
- Adelman RC, Ballard FJ, Weinhouse S (1967) Purification and properties of rat liver fructokinase. Journal of Biological Chemistry 242:3360–3365.
- Mayes PA (1993) Intermediary metabolism of fructose. American Journal of Clinical Nutrition 58:754S-765S.
- Erkin-Cakmak A, Bains Y, Caccavello R, Noworolski SM, Schwarz JM, Mulligan K, Lustig RH, Gugliucci A (2019) Isocaloric Fructose Restriction Reduces Serum d-Lactate Concentration in Children with Obesity and Metabolic Syndrome. Journal of Clinical Endocrinology and Metabolism 104:3003–3011.
- Parks EJ, Skokan LE, Timlin MT, Dingfelder CS (2008) Dietary sugars stimulate fatty acid synthesis in adults. Journal of Nutrition 138:1039–1046.
- Carmona A, Freedland RA (1989) Comparison among the lipogenic potential of various substrates in rat hepatocytes: The differential effects of fructose-containing diets on hepatic lipogenesis. Journal of Nutrition 119:1304–1310.
- Koepsell H (2020) Glucose transporters in the small intestine in health and disease. Pflugers Archiv European Journal of Physiology 472:1207–1248.
- Iynedjian PB (1993) Mammalian glucokinase and its gene. Biochemical Journal 293:1–13.
- Tornheim K, Lowenstein JM (1976) Control of phosphofructokinase from rat skeletal muscle. Effects of fructose diphosphate, AMP, ATP, and citrate. Journal of Biological Chemistry 251:7322–7328.
- Muddada S (2012) Tagatose: the multifunctional food ingredient and potential drug. Journal of Pharmacy Research 5:626–631.
- Nelson DL, Cox MM (2013) Cholesterol, Steroids, and Isoprenoids: Biosynthesis, Regulation, and Transport. In: Principles of Biochemistry, 6th ed. W. H. Freeman and Company, New York, pp 864–869.
- Mttp microsomal triglyceride transfer protein [ Rattus norvegicus (Norway rat) ].
- Kwon EJ, Kim YJ (2017) What is fetal programming?: A lifetime health is under the control of in utero health. Obstetrics and Gynecology Science 60:506–519.
- Fowden AL, Coan PM, Angiolini E, Burton GJ, Constancia M (2011) Imprinted genes and the epigenetic regulation of placental phenotype. Progress in Biophysics and Molecular Biology 106:281–288.
- Rodríguez L, Panadero MI, Rodrigo S, Roglans N, Otero P, Álvarez-Millán JJ, Laguna JC, Bocos C (2016) Liquid fructose in pregnancy exacerbates fructose-induced dyslipidemia in adult female offspring. Journal of Nutritional Biochemistry 32:115–122.
- Fauste E, Rodrigo S, Rodríguez L, Donis C, García A, Barbas C, Álvarez-Millán JJ, Panadero MI, Otero P, Bocos C (2020) FGF21-protection against fructose-induced lipid accretion and oxidative stress is influenced by maternal nutrition in male progeny. Journal of Functional Foods 64:
- Rodríguez L, Panadero MI, Roglans N, Otero P, Álvarez-Millán JJ, Laguna JC, Bocos C (2013) Fructose during pregnancy affects maternal and fetal leptin signaling. Journal of Nutritional Biochemistry 24:1709–1716.
- Yamazaki M, Yamada H, Munetsuna E, et al (2018) Excess maternal fructose consumption impairs hippocampal function in offspring via epigenetic modification of BDNF promoter. FASEB Journal 32:2549–2562.
- Rodrigo S, Fauste E, de la Cuesta M, Rodríguez L, Álvarez-Millán JJ, Panadero MI, Otero P, Bocos C (2018) Maternal fructose induces gender-dependent changes in both LXRα promoter methylation and cholesterol metabolism in progeny. Journal of Nutritional Biochemistry 61:163–172.
- Merck, Sigma Aldrich Universal SYBR Green qPCR Protocol.
- Michihara A, Anraku M, Abe A, Kinoshita H, Kamizaki Y, Tomida H, Akasaki K (2011) Comparison of receptors and enzymes regulating cholesterol levels in liver between SHR/NDmcr-cp rats and normotensive Wistar Kyoto rats at ten weeks of age. Biological and Pharmaceutical Bulletin 34:1116–1119.