1. Introduction
Immunoassays are widely used to measure a huge variety of analytes including hormones, tumor and cardiac biomarkers, vitamins, or drugs. The highly specific interaction between streptavidin and biotin has been exploited for the development of robust and sensitive immunoassays by many manufacturers (1).
Biotin is a water soluble vitamin, also known as vitamin B7, which is found in the normal diet (eggs, pork, cereals) and that serves as a cofactor for carboxylation reactions involved in cellular metabolism (2, 3). The Adequate Intake (AI) level in adults has been estimated in 30 µg/day (4). Biotin deficiency is not a common disorder, but supplementation is prescribed frequently for individuals with intestinal malabsorption, pregnant women, or patients with metabolic disorders (4-6), which receive doses ranging from 10 to 40 mg per day (5-7). More recently, very high doses of biotin (300 mg per day) have been proposed in some clinical protocols as part of the treatment of multiple sclerosis and other demyelinating disorders (7, 8). In addition, self-medication with supraphysiological doses of biotin has emerged as a way to reduce hair loss or fortify hair and nails (up 20 mg per day). Being not considered as drug by patients, many do not mention that they are using it when their doctor asks them about their medications (7).
Exogenous biotin has been recognized as an interference factor in streptavidin-biotin based immunoassays, because biotin in the sample competes with biotinylated reagents for the binding sites on streptavidin (7, 9). The first case in which biotin interference was reported was a misdiagnosis of Grave´s disease due to falsely low TSH and high fT4 results (10). As is well known, biotin can cause falsely low results in the sandwich (immunometric) assays used to measure large molecules, and false increases in the competitive assays (7, 11) used for measuring small molecules. Therefore, biotin interference can cause elevated free T3 and free T4 concentrations and low TSH levels, as well as spuriously high cortisolemias with blunted ACTH concentrations. Similarly, elevated concentrations of 25OH vitamin D associated with suppressed PTH levels have been described (7). These facts can confuse the clinicians, leading to misdiagnoses and eventually inappropriate treatments (10-12). Typical dietary intake of biotin has been reported to be insufficient to affect the streptavidin-biotin-based immunoassays. However, supplements containing 10 mg or more of biotin are cause of spurious results in several immunoassays (13). Oral administration of biotin doses of 10 mg resulted in peak plasma concentrations ranging from 53 ng/mL to 141(14), whereas the threshold most frequently described as critical is >50 ng/mL (15).
The purpose of our study is to determine the influence of biotin in several endocrine, tumor marker, and vitamin assays performed by an electrochemiluminescence method (Roche Diagnostics®). We have tried to define the critical plasma level which causes biotin interference for each immunoassay.
2. Material and methods
2.1 Preparation of samples
We followed the procedure described by Li et al (9) with slight modifications. Briefly, biotin (Sigma-Aldrich) was dissolved in a phosphate-buffered saline (PBS) solution free of calcium and magnesium to prepare a stock solution with 100 µg/mL. This solution was serially diluted with PBS to yield working solutions with different biotin concentrations (10 µg/mL, 7,500, 5,000, 2,500, 1,250, 625 and 312,5 ng/mL), with which we spiked the samples. We used commercial quality controls as samples, containing at least two different analyte concentrations. Samples were spiked with the different working biotin solutions, resulting in the following final biotin concentrations in the samples: 31.25, 62.5, 125, 250, 500, 750, and 1,000 ng/mL. As reference we used the same control samples spiked with an equivalent volume of PBS. Each serum biotin dilution was tested in triplicate. At least two levels of analyte concentration were assayed to assess the influence of analyte concentration on the interference. Table 1 shows the analyte concentration in each pool.
2.2. Immunoassays
Analytes were measured on the cobas e801 (TSH, free thyroxin, free T3, FSH, LH, prolactin, estradiol, progesterone, testosterone, alpha-fetoprotein, carcinoembrionic antigen, CA 15-3, CA 125, prostate specific antigen, free prostate specific antigen, vitamin B12, folate, 25-hydroxyvitamin D) and cobas e411 (parathyrine, cortisol, C-terminal collagen type I peptides, CA 19-9, antigen HE4, antithyroglobulin antibodies, and antithyroperoxidase antibodies). Both competitive and sandwich immunoassays are electrochemiluminescence-based. Briefly, an analyte analogue in the competitive design or detection antibodies in the immunometric design is labeled with a ruthenium chelate. Streptavidin-covered magnetic microparticles bind to the biotinylated analyte (or capture antibody) and attach to the surface of an electrode due to magnetic force. Finally, an electric current which induces a chemiluminescent reaction in ruthenium is applied, being the intensity of chemiluminescence related to analyte concentration.
2.3. Statistics
Statistical comparison between the results obtained by analyzing the biotin-spiked samples and the reference PBS-spiked samples was performed using Microsoft Excel. The relative bias with the interferent-free specimen was calculated using the equation 100 x (Ci – C0) / C0, where Ci is the concentration obtained when analyzing the interferent-spiked specimen and C0 is the concentration in the specimen devoid of interferent. Interference was considered significant when the relative bias exceeded 10% (9). In addition, we performed a Glick interferograph plotting the percentage of change vs. biotin concentration.
3. Results
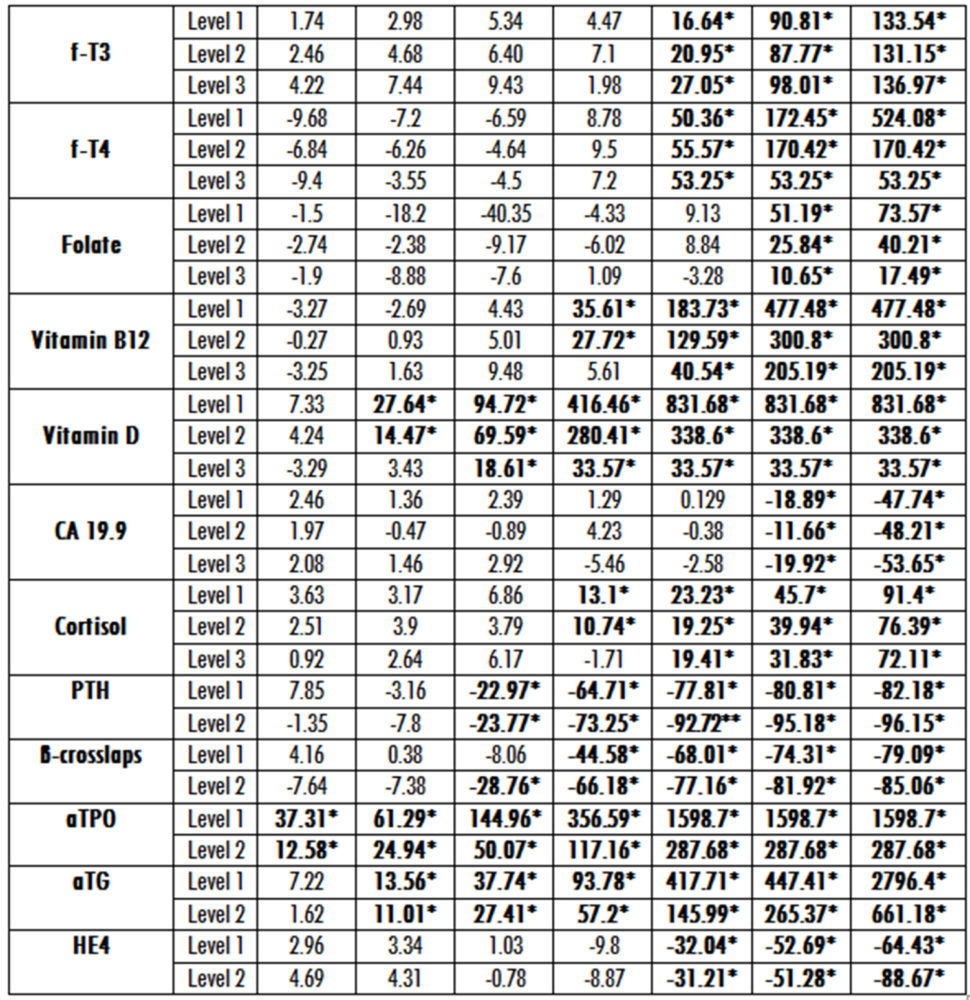
In table 2 we show the deviation of the immunoassays results after spiking with various concentrations of biotin each level of the considered constituent. As expected, there was a strong association between the plasma biotin concentrations and the degree of interference in nearly all the immunoassays assessed. From these data we can conclude that results were spuriously decreased in 12 sandwich immunoassays and falsely increased in 11 competitive immunoassays. However, when analyzing thyrotropin (TSH) or CA 15.3 antigen the results were not significantly affected in any of the three levels of analyte concentration assessed (data not shown on the table 2).
From data analysis we can infer that biotin interference was non-dependent of analyte concentration for free thyroxin, free T3, prolactin, estradiol, folate, progesterone, testosterone, alpha-fetoprotein, carcinoembrionic antigen, CA125, CA19-9, HE4 antigen, antithyroglobulin antibodies, or antithyroperoxidase antibodies. On the opposite, the bias due to biotin was analyte concentration dependent for FSH, LH, prostate specific antigen, free prostate specific antigen, vitamin B12, 25-hydroxyvitamin D, parathyrine, cortisol, and C-terminal collagen type I peptides.
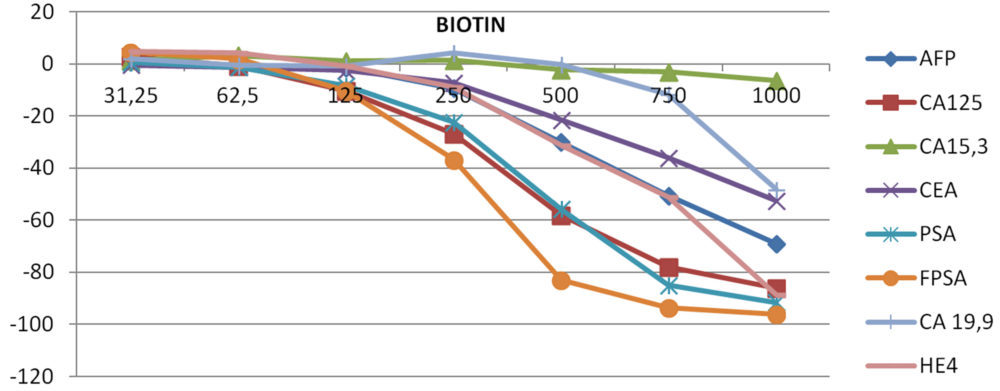
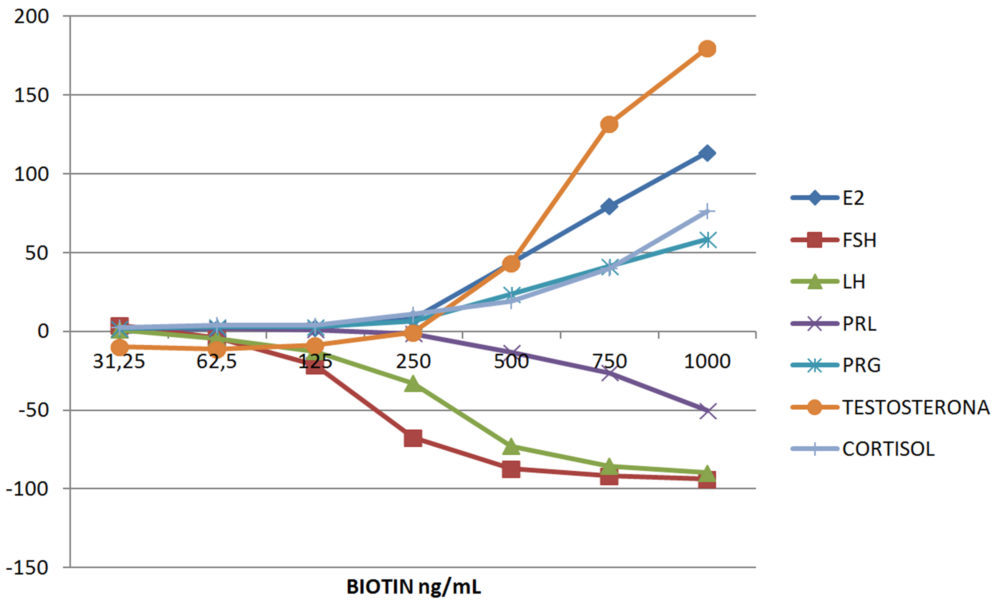
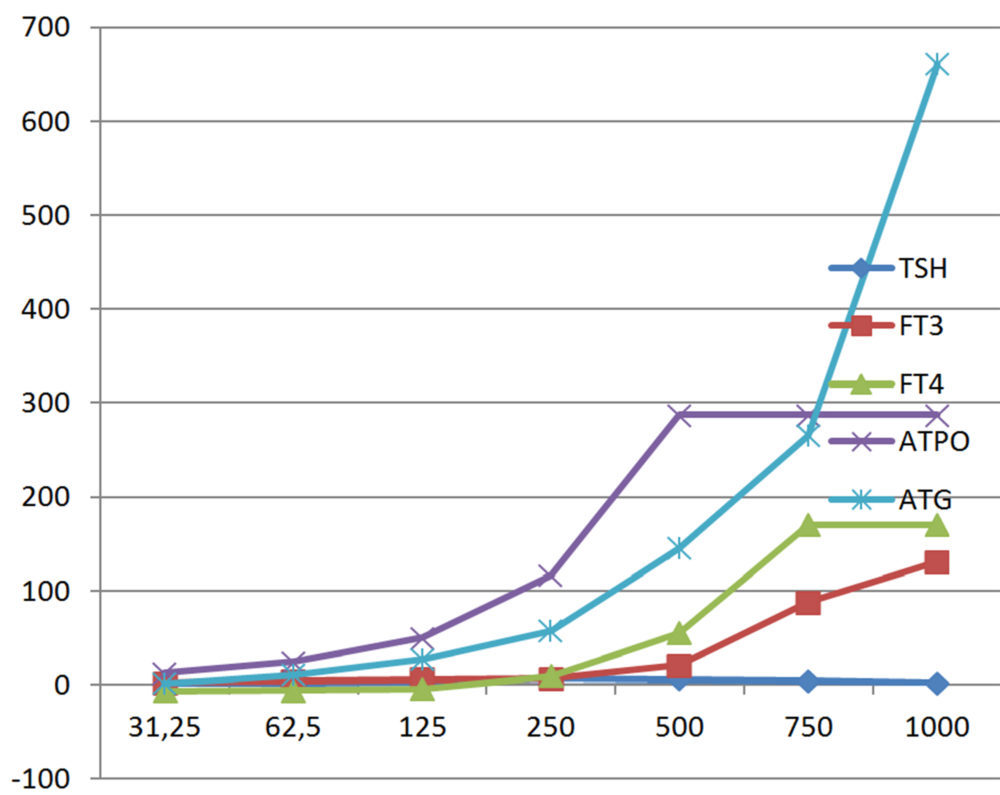
Figure 1 shows Glick´s interferographs for four different panels: thyroid, bone metabolism and vitamins, tumor markers, and gonadal axis. For these, we have considered only the medium concentration of analyte.
Table 1. Baseline concentrations of analytes
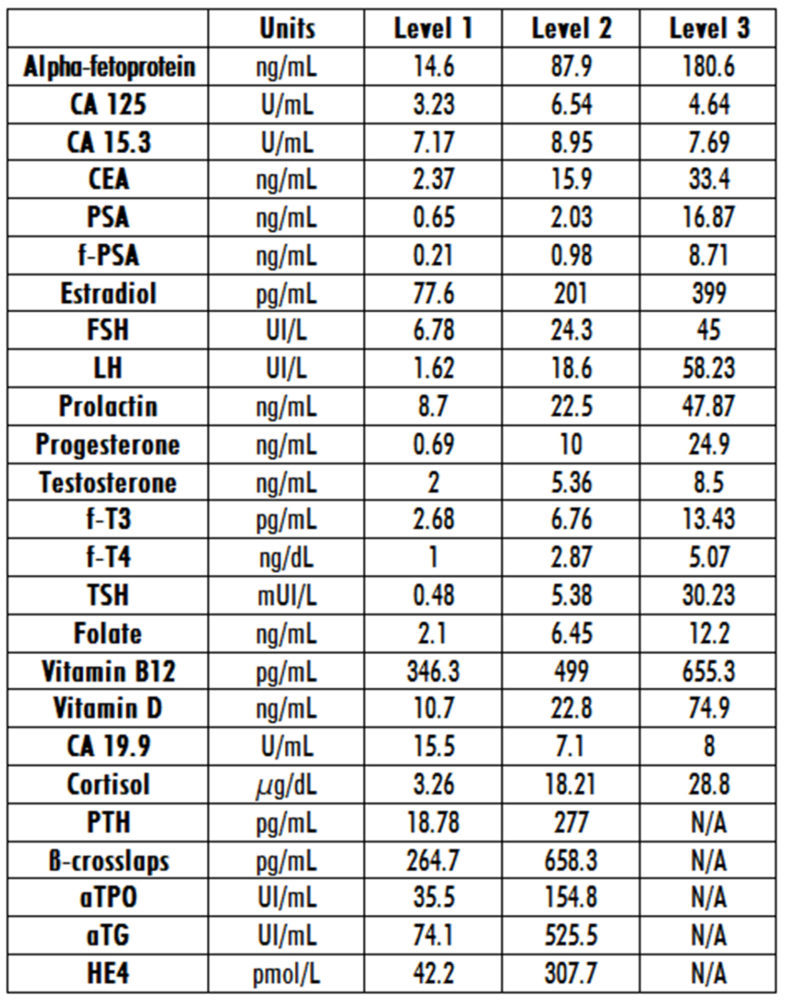
Table 2. Relative bias for each biotin concentration at three different levels of analyte. Asterisks indicate the level which produces significant interference
Interferographs at the medium level of analytes
A. TUMOR MARKERS
B.
C. GONADAL AXIS AND CORTISOL
D. THYROID PANEL
E. BONE METABOLISM AND VITAMINS
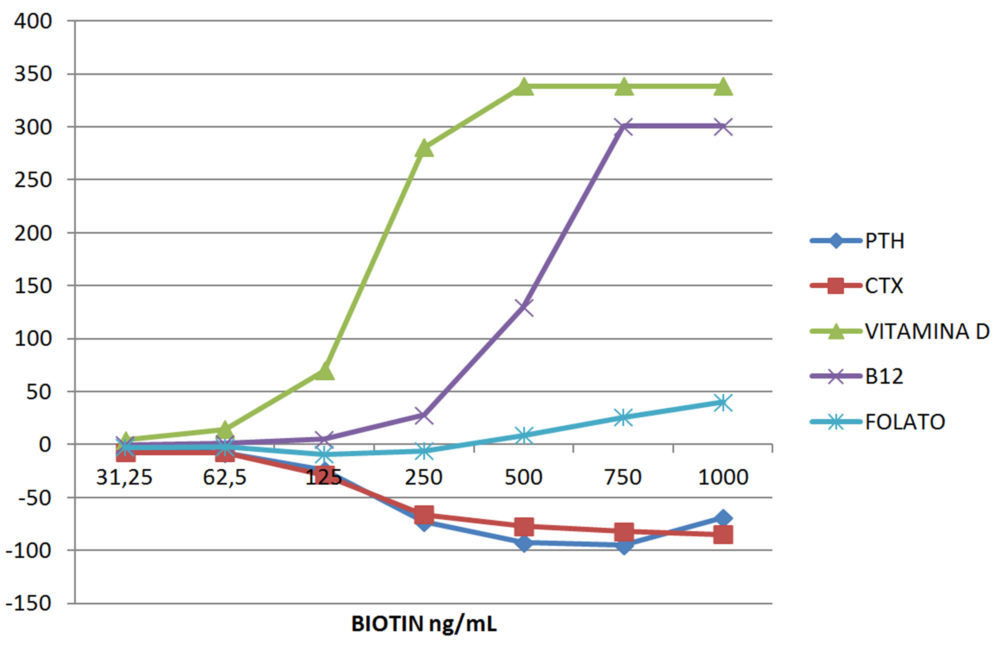
Figura 1. Interferographs at increasing concentrations of biotin grouped in four different panels: (A) Tumor markers; (B) Gonadal hormones and cortisol; (C) Thyroid; and (D) Bone metabolism and vitamins
4. Discussion
In our study we have analyzed the vulnerability of the results of electrochemiluminescence immunoassays on the Roche e801 and e411 platforms when rising concentrations of biotin were added. The addition of biotin to the samples produced falsely low results in sandwich assays (negative interference) and spuriously high results in competitive assays (positive interference), in agreement with previous reports. In some cases, the effect of biotin interference does not depend on analyte concentration. However, for FSH, LH, prostate specific antigen, free prostate specific antigen, vitamin B12, 25-hydroxyvitamin D, parathyrine, cortisol, and C-terminal collagen type I peptides the interference did depend on analyte concentration. Biotin interference was especially noteworthy in the antiperoxidase antibodies (aTPO) test, which was affected even at the lowest biotin concentration (31.25 ng/mL). On the opposite, CA 15.3 and TSH were not affected at all by biotin presence on the sample.
Electrochemiluminescence immunoassay is used in Roche platforms. In the sandwich design one antibody is labeled with ruthenium, which produces the signal, and the second antibody is bound to biotin, which is the captured moiety (17). The antibody complex is captured by streptavidin-coated particles. The analyte concentration is proportional to the signal. Biotin contained in the sample binds to the streptavidin-coated particles, allowing the coupling of less antibody complexes with these microparticles. Consequently, the results are falsely decreased. In contrast, in competitive assays the antigen is labeled with ruthenium, and competes with the analyte for the biotynilated antibodies. In this case, the unlabeled analyte on the sample competes with ruthenium-labeled antigen for the biotinylated antibodies, and the measured signal is inversely proportional to the concentration of analyte. Therefore, biotin presence yields falsely high results.
The increased use of biotin supplements and high doses of therapeutic biotin is not only a specific problem for electrochemiluminescence immunoassays but also a challenge for all clinical laboratories which employ streptavidin-biotin based immunoassays (17, 18, 19). Indeed, investigations performed with spiked samples and studies carried out with healthy volunteers have shown that biotin interferes with many homogeneous and heterogeneous immunoassays which rely on the streptavidin-biotin system [11], Biotin´s interference is particularly important in thyroid hormone assays, with several reported cases of misdiagnosed Grave´s disease (7, 10, 12). Moreover, biotin´s interference can explain other unexpected results in endocrine assays, such as high cortisolemias associated with ACTH suppression, or elevated concentrations of 25-OH vitamin D associated with low PTH levels (7), both due to the presence of biotin in the sample causing falsely low results in sandwich assays (protein, peptides), but falsely high results in competitive assays (small molecules).
Pharmacokinetics studies performed with biotin in healthy volunteers receiving several oral doses reveal that biotin is rapidly absorbed and has an effective serum half-life of 15 h (14). In a group receiving a single oral dose of 1.2 mg, peak serum biotin levels reached 5.5 ng/mL [20]. In the groups that received a single dose of 100, or 300 mg, peak serum biotin reached 494.9 ± 161 ng/mL (at 1.25 h) and 823.8 ± 303.1 ng/mL (at 1.5 h), respectively (21). Serum biotin levels 48 h after administration of oral biotin at various doses were 7.1-43.9 ng/mL (5 mg of biotin), 10.6-56.8 ng/mL (10 mg of biotin), 169-690 ng/mL (100 mg biotin), and 669-1160 ng/mL (300 mg of biotin) (7). The results of population pharmacokinetic analysis show that after the administration of daily doses of biotin of up to 1 mg (80-fold the adequate daily intake), which are found in standard supplement/multivitamin pills, serum biotin levels fall below 10 ng/mL after 2 hours. For doses of biotin of up to 10 mg/day (more than 300-fold the adequate daily intake of biotin), a threshold of serum biotin level of 30 ng/mL was reached after 8 h.
Pharmacokinetics studies suggest that a washout period of biotin is desirable before performing blood analyses which are susceptible to biotin interference. For assays with an interference threshold of 30 ng/mL, an 8 h washout period is enough to mitigate biotin interference in patients taking biotin doses of up 10 mg [14]. However, biotin interference in laboratory test results persisted for up to 24 h in patients taking high doses of biotin (30 mg) (22). Consequently, many manufactures recommend discontinuing biotin intake for at least 24 h before blood sampling (7).
Both immunoassay manufacturers and clinical laboratories are making efforts to prevent errors due to biotin interference. Manufacturers have included the threshold of biotin interference in their package inserts. Clinical biochemists must warn the clinicians about biotin interference medical impact. Some manufacturers are developing methods to minimize biotin interference, such as the use of streptavidin beads to capture excess biotin (18).
A limitation of our study is that we have not considered interferences due to biotin related metabolites such as norbiotin or biotin sulfoxide (20), because the binding of biotin derivatives to avidin has been described, although this binding is less tight than that of the parental compound.
5. CONCLUSIONS
In summary, apart from the CA 15.3 and TSH assays, all the other methods tested in our study were susceptible to biotin interference within the examined biotin concentration range. Falsely low values occurred in sandwich assays and high bias in competitive assays. Clinicians and laboratorians should be aware of the medical importance of biotin interference as a cause of misdiagnosis and incorrect treatment.
Acknowledgments
Author is indebt to Dr. Luis Caballero for the language review support.
6. ReferencEs
- Rulander NJ, Cardamone D, Senior M, Snyder PJ, Master SR. Interference from anti-streptavidin antibody. Arch Pathol Lab Med. 2013; 137: 1441-46
- Katzman BM, Lueke AJ, Donato LJ, Jaffe AS, Bauman NA. Prevalence of biotin supplements usage in outpatients and plasma biotin concentration in patients presenting to the emergency department. Clin Biochem. 2018; 60: 11-16
- Samarasinghe S, Meah F, Singh V, Basit A, Emanuele N, Emanuele M A, Mazhari A, Holmes EW (2017) biotin interference with routine clinical immunoassays: understand the causes and mitigate the risks. Endocrine Practice: August 2017, Vol. 23, No. 8, pp. 989-998
- Zempleni J, Mock DM, Biotin biochemistry and human requirements, J. Nutr. Biochem. (1999); 10 (3) 128–138.
- Otten JJ, Hellwig J.P, Meyers L.D. Dietary Reference Intakes: The Essential Guide to Nutrient Requirements, National Academies Press, 2006.
- J. Zempleni, Y.I. Hassan, S.S. Wijeratne, Biotin and biotinidase deficiency, Exp. Rev.Endocrinol. Metab. (2008); 3 (6) 715–724
- Piketty M-L, Polak M, Flectner I, Gonzales-Briceño L, Souberbielle J-C. False biochemical diagnosis of hyperthyroidism in streptavidin-biotin-based immunoassays: the problem of biotin intake and related interferences. Clin Chem Lab Med. 2017; 55 (6): 780-88.
- Sedel F, Papeix C, Bellanger A, Touitou V, Lebrun-Frenay C, Galanaud D, et al. Mul Scler Relat Disord. 2015; 4 (2): 159-69.
- Li J, Wagar E, Meng QH. Comprehensive assessment of biotin interference in immunoassays. Clin Chim Acta. 2018; 293-298.
- Kummer S, Hemsen D, Distelmeier F. Biotin treatment mimicking Grave´s disease. N Eng J Med. 2016; 18: 375 (7): 704-6.
- Bowen R, Benavides R, Colón-Franco JM, Katzman BM, Muthukumar A, Sadrzadeh H, et al. Best practices in mitigating the risk of biotin interference with laboratory testing. Clin Biochem. 2019; 74: 1-11.
- Elston MS, Sehgal S, Du Toit S, Yarndeley T, Conaglen JV. Factitious Graves disease Due to Biotin Immunoassay Interference-A Case and Review of the Literature. J Clin Endocrinol Metab. 2016; 101
- Li D, Radulescu A, Shrestha R T, Root M, Karger AB, Killeen AA, et al. Association of Biotin Ingestion With Performance of Hormone and Nonhormone Assays in Healthy Adults. JAMA. 2017; 318 (12): 1150-1160.
- Grimsey P, Frey N, Bendig G, Zizler J, Lorenz O, Kasapic D, et al. Population pharmacokinetics of exogenous biotin and relationship between biotin serum levels and in vitro immunoassay interference. Int J Pharmacokinet. 2017; 2: 247-56.
- Peyro Saint Pau L, Debryne D, Bernard D, Mock DM, Defer GL. Pharmacokinetics and pharmacodynamics of MD1003 (high dose biotin) in the treatment of progressive multiple sclerosis. Expert Opin Drug MetabToxicol. 2016; 12: 327-44.
- Glick MR, Ryder KW, Jackson SA. Graphical comparisons of interferences in Clinical Chemistry Instrumentation. Clin Chem. 1986; 32 (3): 470-75.
- Colon PJ, Green DN. Biotin interference in clinical immunoassays. J Appl Lab Med. 2018: 941-951.
- Yang J, Wiencek JR. Mitigating biotin interference in two Roche immunoassays by premixing biotynilated capturing molecules with streptavidin coated beads. Clin Chim Acta. 2020; 505: 130-135.
- Li D , Radulescu, A, Shrestha R, Root M, Karger AB 1, Killeen A, et al. Association of Biotin Ingestion With Performance of Hormone and Nonhormone Assays in Healthy Adults. JAMA. 2017; 318 (12): 1150-1160.
- Mock DM, Mock NJ. Serum concentrations of bisnorbiotin and biotin sulfoxide increase during both acute and chronic biotin supplementation. I Lab Clin Med. 1997; 129: 384-388.
- Peyro Saint Paul L, Debruyne D, Bernard D, Mock DM, Defer GL. Pharmacokinetics and pharmacodynamics of MD1003 (high-dose biotin) in the treatment of progressive multiple sclerosis. Expert Opin Drug Metabol Toxicol. 2016; 12 (3): 327-344.
- Chun KY. Biotin interference in diagnostic tests.Clin Chem. 2017; 63: 619-620.