
Page 76 - 66_04
P. 76
ARMIN WOLF ANAL REAL ACAD. FARM.
stained
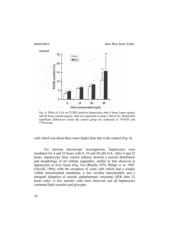
Fig. 4: Effect of CsA on TUNEL-positive hepatocytes after 4 hours (open square)
and 20 hours (closed square). Data are expressed as mean r SD (n=3). Statistically
significant differences versus the control group are expressed as *P0.05 and
***P0.001.
cells which was about three times higher than that in the control (Fig. 4).
For electron microscopy investigations, hepatocytes were
incubated for 4 and 22 hours with 0, 10 and 50 µM CsA. After 4 and 22
hours, hepatocytes from control cultures showed a normal distribution
and morphology of all cellular organelles, similar to that observed in
hepatocytes in liver tissue (Fig. 5A) (Rhodin 1974, Philips et al. 1987,
Cheville 1994), with the exception of some cells which had a weakly
visible mitochondrial membrane, a few swollen mitochondria, and a
marginal dilatation of smooth endoplasmatic reticulum (SER after 22
hours only). A few necrotic cells were observed, and all hepatocytes
contained lipid vacuoles and glycogen.
14