
Page 224 - 73_04
P. 224
ENRIQUE J. DE LA ROSA Y COLS. ANAL. REAL ACAD. NAC. FARM.
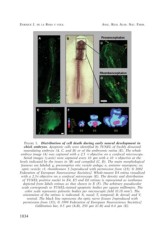
FIGURE 1. Distribution of cell death during early neural development in
chick embryos. Apoptotic cells were identified by TUNEL of freshly dissected
neurulating embryos (A, C, and D) or of the embryonic retina (E). The whole
embryo image (A) was captured with a 2.5 × objective on a confocal microscope.
Serial images (z-axis) were captured every 10 µm with a 10 × objective at the
levels indicated by the insets in (B) and compiled (C, D). The main morphological
features are labeled: g, presumptive otic vesicle anlage; n, anterior neuropore; ov,
optic vesicle; r3, rhombomere 3 [reproduced with permission from (23); © 2002
Federation of European Neuroscience Societies]. Whole-mount E4 retina visualized
with a 2.5× objective on a confocal microscope (E). The density and distribution
of TUNEL positive nuclei in E4, E5 and E6 retinas is represented as isothanas
depicted from labels retinas as that shown in E (F). The arbitrary pseudocolor
scale corresponds to TUNEL-stained apoptotic bodies per square millimetre. The
color scale represents pyknotic bodies per microscopic field (0.18 mm2). The
orientation of the retinas is indicated: N, nasal; T, temporal; D, dorsal; and V,
ventral. The black line represents the optic nerve fissure [reproduced with
permission from (35); © 1999 Federation of European Neuroscience Societies]
Calibration bar, 0.5 µm (A-B), 250 µm (C-D) and 0.4 µm (E).
1034