
Page 89 - 72_ex
P. 89
VOL. 72 (E.), 305-320, 2006 CLIMATOLOGÍA
CUADRO V.
Días de Días de Días de Días de Días de Días con Precip.
Lluvia Nieve Granizo Tormenta Niebla =0,1 =1,0 =10,0 =30,0
Enero 4,9 0,4 0,1 0,0 0,2 5,4 5,1 1,3 0,1
Febrero 6,5 0,4 0,1 0,0 0,0 6,8 6,7 1,5 0,1
Marzo 6,4 0,4 0,0 0,1 0,1 6,7 6,4 1,2 0,0
Abril 6,9 0,2 0,1 0,4 0,1 7,0 7,0 1,3 0,2
Mayo 6,0 0,0 0,0 0,9 0,0 5,9 5,9 1,2 0,1
Junio 3,6 0,0 0,2 1,8 0,0 3,6 3,5 0,9 0,1
Julio 1,1 0,0 0,0 0,9 0,0 1,1 1,0 0,2 0,0
Agosto 1,1 0,0 0,0 0,8 0,0 1,0 0,9 0,1 0,0
Septiembre 2,6 0,0 0,1 0,7 0,0 2,6 2,4 0,4 0,0
Octubre 4,9 0,0 0,0 0,2 0,0 4,8 4,7 1,2 0,1
Noviembre 5,2 0,1 0,0 0,1 0,3 5,2 5,0 1,3 0,2
Diciembre 5,5 0,4 0,1 0,1 1,7 5,8 5,6 1,2 0,1
Anual 54,7 1,9 0,7 6,0 1,4 55,9 54,2 11,8 1,0
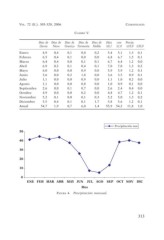
Precipitación mm
50
40
30
20
10
0
ENE FEB MAR ABR MAY JUN JUL AGO SEP OCT NOV DIC
Mes
FIGURA 4. Precipitación mensual.
313