
Page 43 - Demo
P. 43
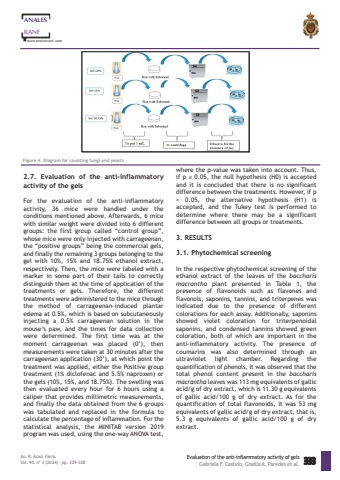
ANALESRANFwww.analesranf.comwhere the p-value was taken into account. Thus,if p %u2265 0.05, the null hypothesis (H0) is acceptedand it is concluded that there is no significantdifference between the treatments. However, if p< 0.05, the alternative hypothesis (H1) isaccepted, and the Tukey test is performed todetermine where there may be a significantdifference between all groups or treatments.3. RESULTS3.1. Phytochemical screeningIn the respective phytochemical screening of theethanol extract of the leaves of the baccharismacrantha plant presented in Table 1, thepresence of flavonoids such as flavones andflavonols, saponins, tannins, and triterpenes wasindicated due to the presence of differentcolorations for each assay. Additionally, saponinsshowed violet coloration for triterpenoidalsaponins, and condensed tannins showed greencoloration, both of which are important in theanti-inflammatory activity. The presence ofcoumarins was also determined through anultraviolet light chamber. Regarding thequantification of phenols, it was observed that thetotal phenol content present in the baccharismacrantha leaves was 113 mg equivalents of gallicacid/g of dry extract, which is 11.30 g equivalentsof gallic acid/100 g of dry extract. As for thequantification of total flavonoids, it was 53 mgequivalents of gallic acid/g of dry extract, that is,5.3 g equivalents of gallic acid/100 g of dryextract.2.7. Evaluation of the anti-inflammatoryactivity of the gels For the evaluation of the anti-inflammatoryactivity, 36 mice were handled under theconditions mentioned above. Afterwards, 6 micewith similar weight were divided into 6 differentgroups: the first group called %u201ccontrol group%u201d,whose mice were only injected with carrageenan,the %u201cpositive groups%u201d being the commercial gels,and finally the remaining 3 groups belonging to thegel with 10%, 15% and 18.75% ethanol extract,respectively. Then, the mice were labeled with amarker in some part of their tails to correctlydistinguish them at the time of application of thetreatments or gels. Therefore, the differenttreatments were administered to the mice throughthe method of carrageenan-induced plantaredema at 0.5%, which is based on subcutaneouslyinjecting a 0.5% carrageenan solution in themouse%u2019s paw, and the times for data collectionwere determined. The first time was at themoment carrageenan was placed (0%u2019), thenmeasurements were taken at 30 minutes after thecarrageenan application (30%u2019), at which point thetreatment was applied, either the Positive grouptreatment (1% diclofenac and 5.5% naproxen) orthe gels (10%, 15%, and 18.75%). The swelling wasthen evaluated every hour for 6 hours using acaliper that provides millimetric measurements,and finally the data obtained from the 6 groupswas tabulated and replaced in the formula tocalculate the percentage of inflammation. For thestatistical analysis, the MINITAB version 2019program was used, using the one-way ANOVA test,Evaluation of the anti-inflammatory activity of gelsGabriela F. Castelo, Gisella A. Paredes et al. 333 An. R. Acad. Farm.Vol. 90. n%u00ba 3 (2024) %u00b7 pp. 329-338Figure 4. Diagram for counting fungi and yeasts
