
Page 122 - 80_02
P. 122
C.
Hernández--Sánchez,
P.
Vázquez,
Flora
de
Pablo
consequences,
since
the
electroporated
chick
embryos
displayed
slower
(53
vs.
100
beats
per
minute)
and
arrhythmic
heart
beats
compared
to
controls
(13).
The
use
of
morpholino--oligonucleotides
against
th
mRNA
allowed
the
knock--down
of
its
expression
in
the
chick
embryo,
leading
to
a
decrease
in
AMHC1
and
Tbx5
expression
together
with
an
atrophic
sinoatrial
region
and
oversized
ventricular
region
(13).
Thus,
TH
action
not
only
induces
cardiac
differentiation
in
vivo
but
the
catecholamine
pathway
regulates
heart
patterning,
conferring
atriogenic
identity.
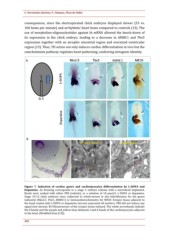
Figure
7.
Induction
of
cardiac
genes
and
cardiomyocytes
differentiation
by
L--DOPA
and
Dopamine.
A)
Drawing
corresponds
to
a
stage
5
embryo
scheme
with
a
microbead
implanted.
Beads
were
soaked
with
either
PBS
(vehicle),
or
a
solution
of
10
µmol/L
L--DOPA
or
dopamine.
Stage
10--12
chick
embryos
were
subjected
to
whole--mount
in
situ
hybridization
for
the
genes
indicated
(Nkx2.5,
Tbx5,
AMHC1)
or
immunohistochemistry
for
MF20.
Ectopic
tissue
adjacent
to
the
bead
coated
with
L--DOPA
or
dopamine
(arrow)
expressed
all
markers.
PBS
did
not
induce
any
signal
(not
shown).
B)
Ultrastructure
of
the
ectopic
tissue
induced.
The
white
arrowheads
indicate
the
Z
bands
and
the
purple
and
yellow
lines
delineate
I
and
A
bands
of
the
cardiomyocytes
adjacent
to
the
bead.
(Modified
from
[13]).
358
