
Page 93 - 79_02
P. 93
Long--life
supplementation
with
atenolol…
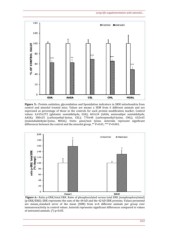
Figure
5.--
Protein
oxidation,
glycoxidation
and
lipoxidation
indicators
in
SKM
mitochondria
from
control
and
atenolol
treated
mice.
Values
are
means
±
SEM
from
6
different
animals
and
are
expressed
as
percentage
of
those
in
the
controls
for
each
protein
modification
marker.
Control
values:
4,415±272
(glutamic
semialdehyde,
GSA);
463±24
(AASA,
aminoadipic
semialdehyde,
AASA);
380±25
(carboxyethyl--lysine,
CEL);
770±48
(carboxymethyl--lysine,
CML);
632±65
(malondialdehyde--lysine,
MDAL).
Units:
µmol/mol
lysine.
Asterisks
represent
significant
differences
between
the
control
and
the
atenolol
group.
**
P<0.01;
***
P<0.001.
Figure
6.--
Ratio
p--ERK/total
ERK.
Ratio
of
phosphorylated
versus
total
ERK
(nonphosphorylated)
(p--ERK/ERK);
ERK
represents
the
sum
of
the
44--kD
and
the
42--kD
ERK
proteins.
Values
presented
are
means_standard
error
of
the
mean
(SEM)
from
n=4
different
animals
per
group
over
immunoreactivity
in
control
values.
Asterisk
represents
significant
differences
compared
to
values
of
untreated
animals.
(*)
p<0.05.
263
