
Page 90 - 79_02
P. 90
A.
Gómez
et
col.
in
heart
mitochondria,
while
the
PI
was
decreased
by
31%
in
SKM
and
by
17%
in
heart
mitochondria.
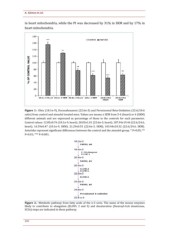
Figure
1.--
Oleic
(18:1n--9),
Docosahexanoic
(22:6n--3)
and
Peroxisomal
Beta--Oxidation
(22:6/24:6
ratio)
from
control
and
atenolol
treated
mice.
Values
are
means
±
SEM
from
5--6
(heart)
or
6
(SKM)
different
animals
and
are
expressed
as
percentage
of
those
in
the
controls
for
each
parameter.
Control
values:
12.85±0.76
(18:1n--9,
heart);
28.03±1.01
(22:6n--3,
heart);
187.94±19.46
(22:6/24.6,
heart);
16.39±0.47
(18:1n--9,
SKM);
21.29±0.53
(22:6n--3,
SKM);
103.44±10.32
(22:6/24.6,
SKM).
Asterisks
represent
significant
differences
between
the
control
and
the
atenolol
group.
*
P<0.05;
**
P<0.01;
***
P<0.001.
Figure
2.--
Metabolic
pathway
from
fatty
acids
of
the
n--3
serie.
The
name
of
the
mouse
enzymes
likely
to
contribute
to
elongation
(ELOVL
2
and
5)
and
desaturation
(Stearoyl--CoA
desaturase,
SCDs)
steps
are
indicated
in
these
pathway.
260
