
Page 91 - 79_02
P. 91
Long--life
supplementation
with
atenolol…
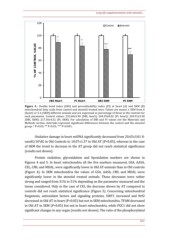
Figure
3.--
Double
bond
index
(DBI)
and
peroxidizability
index
(PI)
in
heart
(A)
and
SKM
(B)
mitochondrial
fatty
acids
from
control
and
atenolol
treated
mice.
Values
are
means
±
SEM
from
6
(heart)
or
5--6
(SKM)
different
animals
and
are
expressed
as
percentage
of
those
in
the
controls
for
each
parameter.
Control
values:
232.60±5.90
(DBI,
heart);
268.39±8.02
(PI,
heart);
203.91±3.38
(DBI,
SKM);
217.36±4.52
(PI,
SKM).
For
calculation
of
DBI
and
PI
values
see
the
Materials
and
Methods
section.
Asterisks
represent
significant
differences
between
the
control
and
the
atenolol
group.
*
P<0.05;
**
P<0.01;
***
P<0.001.
Oxidative
damage
in
heart
mtDNA
significantly
decreased
from
20.65±3.81
8--
oxodG/105dG
in
Old
Controls
to
10.07±1.37
in
Old
AT
(P<0.05),
whereas
in
the
case
of
SKM
the
trend
to
decrease
in
the
AT
group
did
not
reach
statistical
significance
(results
not
shown).
Protein
oxidation,
glycoxidation
and
lipoxidation
markers
are
shown
in
Figures
4
and
5.
In
heart
mitochondria
all
the
five
markers
measured,
GSA,
AASA,
CEL,
CML
and
MDAL,
were
significantly
lower
in
Old
AT--animals
than
in
Old
controls
(Figure
4).
In
SKM
mitochondria
the
values
of
GSA,
AASA,
CML
and
MDAL
were
significantly
lower
in
the
atenolol
treated
animals.
These
decreases
were
rather
strong
and
ranged
from
31%
to
51%
depending
on
the
parameter
measured
and
the
tissue
considered.
Only
in
the
case
of
CEL
the
decrease
shown
by
AT
compared
to
controls
did
not
reach
statistical
significance
(Figure
5).
Concerning
mitochondrial
biogenesis,
antioxidant
factors
and
signaling
proteins,
SIRT1
increased
and
Nrf2
decreased
in
Old
AT
in
heart
(P<0.05)
but
not
in
SKM
mitochondria.
TFAM
decreased
in
Old
AT
in
SKM
(P<0.05)
but
not
in
heart
mitochondria,
while
PGC1
did
not
show
significant
changes
in
any
organ
(results
not
shown).
The
ratio
of
the
phosphorylated
261
