
Page 92 - 79_02
P. 92
A.
Gómez
et
col.
to
total
ERK
(p--ERK/total
ERK)
showed
significantly
higher
values
in
the
atenolol
than
in
the
control
group
(Figure
6).
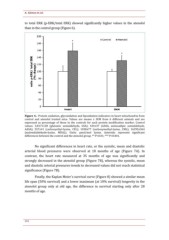
Figure
4.--
Protein
oxidation,
glycoxidation
and
lipoxidation
indicators
in
heart
mitochondria
from
control
and
atenolol
treated
mice.
Values
are
means
±
SEM
from
6
different
animals
and
are
expressed
as
percentage
of
those
in
the
controls
for
each
protein
modification
marker.
Control
values:
3,817±128
(glutamic
semialdehyde,
GSA);
434±37
(AASA,
aminoadipic
semialdehyde,
AASA);
557±41
(carboxyethyl--lysine,
CEL);
1038±77
(carboxymethyl--lysine,
CML);
16295±364
(malondialdehyde--lysine,
MDAL).
Units:
µmol/mol
lysine.
Asterisks
represent
significant
differences
between
the
control
and
the
atenolol
group.
**
P<0.01;
***
P<0.001.
No
significant
differences
in
heart
rate,
or
the
systolic,
mean
and
diastolic
arterial
blood
pressures
were
observed
at
18
months
of
age
(Figure
7A).
In
contrast,
the
heart
rate
measured
at
35
months
of
age
was
significantly
and
strongly
decreased
in
the
atenolol
group
(Figure
7B),
whereas
the
systolic,
mean
and
diastolic
arterial
pressures
trends
to
decreased
values
did
not
reach
statistical
significance
(Figure
7B).
Finally,
the
Kaplan
Meier´s
survival
curve
(Figure
8)
showed
a
similar
mean
life
span
(50%
survival)
and
a
lower
maximum
(at
10%
survival)
longevity
in
the
atenolol
group
only
at
old
age,
the
difference
in
survival
starting
only
after
28
months
of
age.
262
