
Page 140 - 69_01
P. 140
D. FERREIRA Y COLS. ANAL. REAL ACAD. NAL. FARM
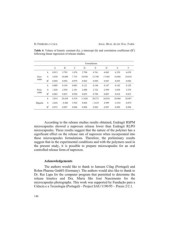
Table 4. Values of kinetic constant (k), y-intercept (b) and correlation coefficient (R2)
following linear regression of release studies.
Formulations
A B C DE D E F
5.795 1.076 6.085 6.329 6.670
k 0.913 16.609 7.735 2.790 4.761 17.402 18.966 24.418
0.956 0.979 0.947 0.955 0.950
Zero- b 5.830 0.144 0.083 10.930 13.740 0.147 0.142 0.129
order R2 0.969 2.930 2.101 2.959 3.050 3.278
0.823 0.920 0.965 0.950 0.807 0.818 0.823
24.654 4.519 26.018 26.968 28.487
k 0.089 - 4.484 3.934 0.121 0.146 4.999 -4.154 -0.075
0.997 0.994 0.997 0.999 0.998
First- b 1.828 2.488 2.722
order R2 0.883
0.855 0.796
k 3.814 11.826 20.272
Higuchi b 2.644 0.864 - 3.619
R2 0.975
0.998 0.992
According to the release studies results obtained, Eudragit RSPM
microcapsules showed a naproxen release lower than Eudragit RLPO
microcapsules. These results suggest that the nature of the polymer has a
significant effect on the release rate of naproxen when incorporated into
these microcapsules formulations. Therefore, the preliminary results
suggest that in the experimental conditions and with the polymers used in
the present study, it is possible to prepare microcapsules for an oral
controlled release form of naproxen.
Acknowledgements
The authors would like to thank to Janssen Cilag (Portugal) and
Rohm Pharma GmbH (Germany). The authors would also like to thank to
Dr. Rui Lapa for the computer program that permitted to determine the
release kinetics and Dra. Maria São José Nascimento for the
microcapsules photographs. This work was supported by Fundação para a
Ciência e a Tecnologia (Portugal) – Project SAU/1190/95 – Praxis 2/2.1.
146