
Page 137 - 69_01
P. 137
VOL. 69 (1), MICROCÁPSULAS ORALES DE LIBERACIÓN CONTROLADA DE NAPROXENO
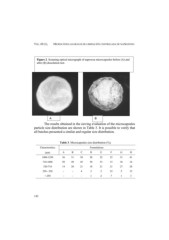
Figure 2. Scanning optical micrograph of naproxen microcapsules before (A) and
after (B) dissolution test.
AB
The results obtained in the sieving evaluation of the microcapsules
particle size distribution are shown in Table 3. It is possible to verify that
all batches presented a similar and regular size distribution.
Table 3. Microcapsules size distribution (%).
Characteristics Formulations
(Pm) ABC D E F GH
1000-1250 36 31 30 28 22 25 31 41
710-1000 50 49 45 50 53 15 36 16
520-710 14 20 21 18 21 21 27 28
250 - 520 --4 3 2 32 5 12
< 250 --- 1 2 7 13
143