Page 138 - 69_01
P. 138

D. FERREIRA Y COLS.         ANAL. REAL ACAD. NAL. FARM

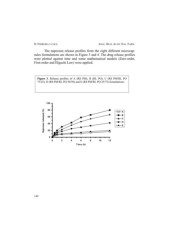
         The naproxen release profiles from the eight different microcap-
sules formulations are shown in Figure 3 and 4. The drug release profiles
were plotted against time and some mathematical models (Zero-order,
First-order and Higuchi Law) were applied.

Figure 3. Release profiles of A (RS PM), B (RL PO), C (RS PM/RL PO
75/25), D (RS PM/RL PO 50/50) and E (RS PM/RL PO 25/75) formulations.

     Naproxen released (%)  100                                                A
                                                                               B
                             80                                                C
                                                                               D
                             60                                                E

                             40

                             20

                               0
                                   0 2 4 6 8 10 12
                                                                     Time (h)

144
   133   134   135   136   137   138   139   140   141   142   143