
Page 42 - 81_03
P. 42
chamber on the stage of a Nikon TE-200 microscope. Cells P2X1 Javier Gualix et al.
were superfused with Locke’s solution, and different P2X4
agonists of the P2 receptors were applied in 30s pulses. P2X5 AB
When the experiments were performed using P2 receptor P2X6
antagonists (MRS2179, TNP-ATP) or potentiators P2X7 CD
(ivermectin), these compounds were superfused for 2 min
before the application of the corresponding agonist. EF
Cells were alternately excited at 340 and 380 nm, these GH
wavelengths corresponding to the fluorescence peaks of
Ca2+-saturated and Ca2+-free Fura-2 solutions. The IJ
wavelength of the incoming light was selected with the aid
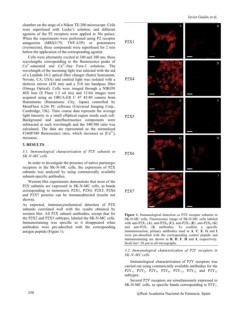
of a Lambda 10-2 optical filter changer (Sutter Instrument, Figure 1. Immunological detection os P2X receptor subunits in
Novato, CA, USA) and emitted light was isolated with a SK-N-MC cells. Fluorescence image of SK-N-MC cells labeled
dichroic mirror (430 nm) and a 510 nm bandpass filter with anti-P2X1 (A), anti-P2X4 (C), anti-P2X5 (E), anti-P2X6 (G)
(Omega Optical). Cells were imaged through a NIKON and anti-P2X7 (I) antibodies. To confirm a specific
40X lens (S Fluor 1.3 oil iris) and 12-bit images were immunoreaction, primary antibodies used in A, C, E, G and I
acquired using an ORCA-ER C 47 42-80 camera from were pre-absorbed with the corresponding control peptide and
Hamamatsu (Hamamatsu City, Japan) controlled by immunostaining are shown in B, D, F, H and J, respectively.
MetaFluor 6.2r6 PC software (Universal Imaging Corp., Scale bar= 20 µm in all micrographs.
Cambridge, UK). Time course data represent the average
light intensity in a small elliptical region inside each cell. 3.2. Immunological characterization of P2Y receptors in
Background and autofluorescence components were SK-N-MC cells
subtracted at each wavelength and the 340/380 ratio was
calculated. The data are represented as the normalized Immunological characterization of P2Y receptors was
F340/F380 ?uorescence ratio, which increases as [Ca2+]i carried out using commercially available antibodies for the
increases. P2Y1, P2Y2, P2Y4, P2Y6, P2Y11, P2Y12 and P2Y13
subtypes.
3. RESULTS
Several P2Y receptors are simultaneously expressed in
3.1. Immunological characterization of P2X subunits in SK-N-MC cells, as specific bands corresponding to P2Y1,
SK-N-MC cells
@Real Academia Nacional de Farmacia. Spain
In order to investigate the presence of native purinergic
receptors in the SK-N-MC cells, the expression of P2X
subunits was analyzed by using commercially available
subunit-specific antibodies.
Western blot experiments demonstrate that most of the
P2X subunits are expressed in SK-N-MC cells, as bands
corresponding to monomeric P2X1, P2X4, P2X5, P2X6
and P2X7 proteins can be immunodetected (results not
shown).
As expected, immunocytochemical detection of P2X
subunits correlated well with the results obtained by
western blot. All P2X subunit antibodies, except that for
the P2X2 and P2X3 subtypes, labeled the SK-N-MC cells.
Immunostaining was specific as it disappeared when
antibodies were pre-adsorbed with the corresponding
antigen peptide (Figure 1).
250