
Page 74 - 76_03
P. 74
ALBERTO BARTOLOMÉ Y COLS. AN. R. ACAD. NAC. FARM.
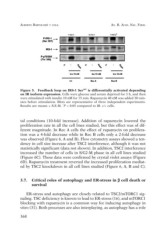
Figure 5. Feedback loop on IRS-1 Ser307 is differentially activated depending
on IR isoform expression. Cells were glucose and serum deprived for 3 h, and then
were stimulated with insulin 10 nM for 15 min. Rapamycin 40 nM was added 30 min-
utes before stimulation. Blots are representative of three independent experiments.
Results are means ± S.E.M. *P < 0.05 compared to IR +/+ cells.
tal conditions (10-fold increase). Addition of rapamycin lowered the
proliferation rate in all the cell lines studied, but this effect was of dif-
ferent magnitude. In Rec A cells the effect of rapamycin on prolifera-
tion was a 4-fold decrease while in Rec B cells only a 2-fold decrease
was observed (Figure 6, A and B). Flow cytometry assays showed a ten-
dency in cell size increase after TSC2 interference, although it was not
statistically significant (data not shown). In addition, TSC2 interference
increased the number of cells in S/G2-M phase in all cell lines studied
(Figure 6C). These data were confirmed by crystal violet assays (Figure
6D). Rapamycin treatment reverted the increased proliferation mediat-
ed by TSC2 knockdown in all cell lines studied (Figure 6, A, B and C).
3.7. Critical roles of autophagy and ER-stress in ß cell death or
survival
ER-stress and autophagy are closely related to TSC2/mTORC1 sig-
naling. TSC deficiency is known to lead to ER-stress (16), and mTORC1
blocking with rapamycin is a common way for inducing autophagy in
vitro (31). Both processes are also interplaying, as autophagy has a role
368