
Page 114 - 76_01
P. 114
ÓSCAR ESCRIBANO Y COLS. AN. R. ACAD. NAC. FARM.
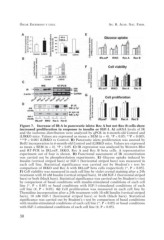
Figure 7. Increase of IR-A in pancreatic islets: Rec A but not Rec B cells show
increased proliferation in response to insulin or IGF-1. A) mRNA levels of IR
and the isoforms distribution were analyzed by qPCR in 6-month-old Control and
iLIRKO mice. Values are expressed as mean ± SEM (n = 4). *P < 0.05; **P < 0.005;
***P < 0.001 iLIRKO vs Control. B) Pancreatic islets proliferation was assesed by
BrdU incorporation in 6-month-old Control and iLIRKO mice. Values are expressed
as mean ± SEM (n = 4). *P < 0.05. C) IR expression was analyzed by Western Blot
and RT-PCR in IRLoxP, IRKO, Rec A and Rec B beta cells. A representative
experiment out of four is shown. D) Functional assessment of IR reconstitution
was carried out by phosphorylation experiments. E) Glucose uptake induced by
Insulin (vertical striped bars) or IGF-1 (horizontal striped bars) was measured in
each cell line. Statistical significance was carried out by Student’s t test by
comparison of IRKO and Rec A with IRLoxP beta cells respectively (*, P < 0.05).
F) Cell viability was measured in each cell line by violet crystal staining after a 24h
treatment with 10 nM Insulin (vertical striped bars), 10 nM IGF-1 (horizontal striped
bars) or both (black bars). Statistical significance was carried out by Student’s t test
by comparison of basal conditions with insulin-stimulated conditions of each cell
line (*, P < 0.05) or basal conditions with IGF-1-stimulated conditions of each
cell line (#, P < 0.05). G) Cell proliferation was measured in each cell line by
Thymidine incorporation after a 24h treatment with 10 nM Insulin (vertical striped
bars), 10 nM IGF-1 (horizontal striped bars) or both (black bars). Statistical
significance was carried out by Student’s t test by comparison of basal conditions
with insulin-stimulated conditions of each cell line (*, P < 0.05) or basal conditions
with IGF-1-stimulated conditions of each cell line (#, P < 0.05).
38