
Page 112 - 76_01
P. 112
ÓSCAR ESCRIBANO Y COLS. AN. R. ACAD. NAC. FARM.
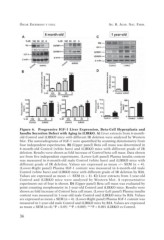
Figure 6. Progressive IGF-1 Liver Expression, Beta-Cell Hyperplasia and
Insulin Secretion Defect with Aging in iLIRKO. A) Liver extracts from 6-month-
old Control and iLIRKO mice with different IR deletion were analyzed by Western
blot. The autoradiograms of IGF-1 were quantified by scanning densitometry from
four independent experiments. B) (Upper panel) Beta cell mass was determined in
6-month-old Control (white bars) and iLIRKO mice with different grade of IR
deletion. Results were shown as fold increase of Control beta cell mass. Data shown
are from five independent experiments. (Lower-Left panel) Plasma insulin content
was measured in 6-month-old male Control (white bars) and iLIRKO mice with
different grade of IR deletion. Values are expressed as mean +/– SEM (n = 4).
(Lower-Right panel) Plasma IGF-1 content was measured in 6-month-old male
Control (white bars) and iLIRKO mice with different grade of IR deletion by RIA.
Values are expressed as mean +/– SEM (n = 4). C) Liver extracts from 1-year-old
Control and iLIRKO mice were analyzed by Western blot. A representative
experiment out of four is shown. D) (Upper panel) Beta cell mass was evaluated by
point counting morphometry in 1-year-old Control and iLIRKO mice. Results were
shown as fold increase of Control beta cell mass. (Lower-Left panel) Plasma insulin
content was measured in 1-year-old male Control and iLIRKO mice by RIA. Values
are expressed as mean ± SEM (n = 4). (Lower-Right panel) Plasma IGF-1 content was
measured in 1-year-old male Control and iLIRKO mice by RIA. Values are expressed
as mean ± SEM (n=4).*P < 0.05; **P < 0.005; ***P < 0.001 iLIRKO vs Control.
36