
Page 105 - 79_04
P. 105
Reduction
in
mitochondrial
membrane
peroxidizability
index…
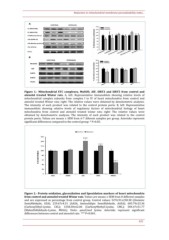
Figure
1.--
Mitochondrial
ETC
complexes,
MnSOD,
AIF,
SIRT3
and
SIRT5
from
control
and
atenolol
treated
Wistar
rats.
A,
left:
Representative
immunoblots
showing
relative
levels
of
mitochondrial
complex
subunits
from
complex
I
to
IV
of
heart
mitochondria
from
control
and
atenolol
treated
Wistar
rats;
right:
The
relative
values
were
obtained
by
densitometric
analyses.
The
intensity
of
each
product
was
related
to
the
control
protein
porin.
B,
left:
Representative
immunoblots
showing
relative
levels
of
regulatory
factors
of
mitochondrial
biology
of
heart
mitochondria
from
control
and
atenolol
treated
wistar
rats;
right:
The
relative
values
were
obtained
by
densitometric
analyses.
The
intensity
of
each
product
was
related
to
the
control
protein
porin.
Values
are
means
±
SEM
from
6--7
diferent
samples
per
group.
Asterisks
represent
significant
differences
compared
to
the
control
group:
*
P<0.05.
Figure
2.--
Protein
oxidation,
glycoxidation
and
lipoxidation
markers
of
heart
mitochondria
from
control
and
atenolol
treated
Wistar
rats.
Values
are
means
±
SEM
from
8
different
samples
and
are
expressed
as
percentage
from
control
group.
Control
values:
5276.91±238.38
(Glutamic
SemiAldehyde,
GSA);
229.67±4.31
(AASA,
AminoAdipic
SemiAldehyde,
AASA);
605.79±23.36
(CarboxyEthyl--Lysine,
CEL);
1558.30±62.06
(CarboxyMethyl--Lysine,
CML);
584.47±51.77
(MalonDiAldehyde--Lysine,
MDAL).
Units:
µmol/mol
lysine.
Asterisks
represent
significant
differences
between
control
and
atenolol
rats:
***
P<0.001.
621
