
Page 104 - 79_04
P. 104
Alexia
Gómez
&
col.
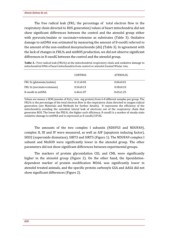
The
free
radical
leak
(FRL;
the
percentage
of
total
electron
flow
in
the
respiratory
chain
directed
to
ROS
generation)
values
of
heart
mitochondria
did
not
show
significant
differences
between
the
control
and
the
atenolol
group
either
with
pyruvate/malate
or
succinate+rotenone
as
substrates
(Table
3).
Oxidative
damage
to
mtDNA
was
estimated
by
measuring
the
amount
of
8--oxodG
referred
to
the
amount
of
the
non--oxidized
deoxynucleoside
(dG)
(Table
3).
In
agreement
with
the
lack
of
changes
in
FRL%
and
mitROS
production,
we
did
not
observe
significant
differences
in
8--oxodG
between
the
control
and
the
atenolol
group.
Table
3.--
Free
radical
leak
(FRL%)
at
the
mitochondrial
respiratory
chain
and
oxidative
damage
to
mitochondrial
DNA
of
heart
mitochondria
from
control
or
atenolol
treated
Wistar
rats.
CONTROL
ATENOLOL
FRL
%
(glutamate/malate)
0.11±0.03
0.06±0.01
FRL
%
(succinate+rotenone)
0.56±0.13
0.58±0.10
8--oxodG
in
mtDNA
6.46±1.07
8.65±1.25
Values
are
means
±
SEM
(nmoles
of
H2O2/
min
.
mg
protein)
from
6--8
different
samples
per
group.
The
FRL%
is
the
percentage
of
the
total
electron
flow
in
the
respiratory
chain
directed
to
oxygen
radical
generation
(see
Materials
and
Methods
for
further
details).
It
represents
the
efficiency
of
the
mitochondria
avoiding
the
univalent
lateral
leak
of
electrons
out
of
the
respiratory
chain
that
generates
ROS.
The
lower
the
FRL%,
the
higher
such
efficiency.
8--oxodG
is
a
marker
of
steady--state
oxidative
damage
to
mtDNA
and
is
expressed
as
8--oxodG/105dG.
The
amounts
of
the
two
complex
I
subunits
(NDUFS3
and
NDUFA9),
complex
II,
III
and
IV
were
measured,
as
well
as
AIF
(apoptosis
inducing
factor),
SOD2
(superoxide
dismutase),
SIRT3
and
SIRT5
(Figure
1).
The
NDUFA9
complex
I
subunit
and
MnSOD
were
significantly
lower
in
the
atenolol
group.
The
other
parameters
did
not
show
significant
differences
between
experimental
groups.
The
markers
of
protein
glycoxidation
CEL
and
CML
were
significantly
higher
in
the
atenolol
group
(Figure
2).
On
the
other
hand,
the
lipoxidation--
dependent
marker
of
protein
modification
MDAL
was
significantly
lower
in
atenolol
treated
animals,
and
the
specific
protein
carbonyls
GSA
and
AASA
did
not
show
significant
differences
(Figure
2).
620
