
Page 68 - 76_03
P. 68
ALBERTO BARTOLOMÉ Y COLS. AN. R. ACAD. NAC. FARM.
35, 2 mM MnCl2) with 400 U of ?-Phosphatase (Sigma), and then the
mixture was incubated for 1 h at 30 °C.
2.6. Statistics
Statistically signi?cant differences between mean values were de-
termined using paired Student t-test for paired comparisons. One-way
ANOVA and Tukey tests were used for multiple comparisons.
Differences were considered statistically signi?cant at P < 0.05.
3. RESULTS
3.1. Characterization of pancreatic ß cell lines
Different ß cell lines were generated and used in our study (IR +/+,
IR -/-, Rec A and Rec B). From an IR -/- ß cell line generated in a pre-
vious work (10), Rec A and Rec B cell lines were reconstituted by
retrovirus-mediated transfection with a human IRA or IRB encoding
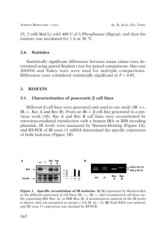
plasmids. IR levels were measured by Western-blotting (Figure 1A),
and RT-PCR of IR exon 11 mRNA determined the specific expression
of both isoforms (Figure 1B).
Figure 1. Specific recostitution of IR isoforms. A) IR expression by Western-blot
in the different pancreatic ß cell lines: IR +/+, IR -/-, and reconstituted cell lines sta-
bly expressing IRA (Rec A), or IRB (Rec B). A densitometric analysis of the IR levels
is shown, data are presented as means ± S.E.M. (n = 5). B) Total RNA was isolated,
and IR exon 11 expression was checked by RT-PCR.
362