
Page 141 - 72_03
P. 141
VOL. 72 (3), 463-487, 2006 SPECTROPHOTOMETRIC CHARACTERISATION OF THE...
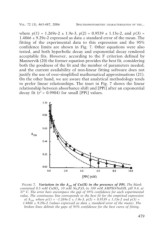
where p(1) = 1.269e-2 ± 1.9e-3, p(2) = 0.9539 ± 1.13e-2, and p(3) =
1.4866 ± 9.29e-2 expressed as data ± standard error of the mean. The
fitting of the experimental data to this expression and the 95%
confidence limits are shown in Fig. 7. Other equations were also
tested, and both hyperbolic decay and exponential decay rendered
acceptable fits. However, according to the F criterion defined by
Mannervik (20) the former equation provides the best fit, considering
both the goodness of the fit and the number of parameters needed,
and the current availability of non-linear fitting software does not
justify the use of over-simplified mathematical approximations (21).
On the other hand, we are aware that analytical methodology tends
to prefer linear relationships. The inset in Fig. 7 shows the linear
relationship between absorbance shift and [PPi] after an exponential
decay fit (r2 = 0.9904) for small [PPi] values.
FIGURE 7. Variation in the A280 of Cu(II) in the presence of PPi. The blank
contained 0.5 mM CuSO4, 10 mM Na4P2O7 in 100 mM AMPSO/NaOH, pH 9.4, at
37º C. The error bars encompass the gap of 95% confidence for each experimental
value. The continuous line corresponds to the best fit for the empirical expression
of A280, where p(1) = –1.269e-2 ± 1.9e-3, p(2) = 0.9539 ± 1.13e-2 and p(3) =
1.4866 ± 9.29e-2 (values expressed as data ± standard error of the mean). The
broken lines delimit the gaps of 95% confidence for the best curve of fitting.
479