
Page 136 - 72_03
P. 136
M. FE DE LA TORRE Y COLS. AN. R. ACAD. NAC. FARM.
A = A + A + A280, tot
280,Cu' 280,CuP2O72- 280,Cu(P2O7 )26-
eA280,Cu' = Cu' [Cu'] l
eA [CuP O ] l=280,CuP2O72-
CuP2O72- 2-
27
A e [Cu(P O ) ] l=280,Cu(P2O7 )26-
Cu(P2O7 )26- 6-
2 72
where eCu´ represents the molar absorbance of all the species of Cu(II)
in solution except for the complexes with PPi. According to the values
obtained previously, it is assumed that virtually all the Cu not
complexed with PPi appears as dihydroxicuprate, thus allowing us to
consider a unique molar absorbance for all these species.
To determine the molar absorbance of the species in solution,
four experimental data series were generated with increasing
concentrations of Cu(II) in the 0.01 to 0.3 mM range: one series in
the absence of PPi, and three with constant [Cu]tot:[PPi]tot ratios of
2:1, 1:1 and 1:10, respectively. For each series A280 was measured.
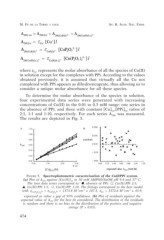
The results are depicted in Fig. 5.
FIGURE 5. Spectrophotometric caracterisation of the CuII/PPi system.
(a) Plot of A280 against [Cu(II)]tot in 50 mM AMPSO/NaOH pH 9.4 and 37º C.
The four data series correspond to: !, absence of PPi; ÿ, Cu(II):PPi 2:1;
!, Cu(II):PPi 1:1; &, Cu(II):PPi 1:10. The fittings correspond to the best model
with eCu(P2O7)26– = eCuP2O72– = 1373.8 M–1cm–1 ± 107.3, eCu’ = 3372.6 M–1cm–1 ± 43.9,
expressed as value ± gap of 95% confidence. (b) Plot of residuals against the
expected value of A280 for the best fit considered. The distribution of the residuals
is random and there is no bias in the distribution of the positive and negative
strings (P > 0.05).
474