
Page 139 - 72_03
P. 139
VOL. 72 (3), 463-487, 2006 SPECTROPHOTOMETRIC CHARACTERISATION OF THE...
eCu’ = 3372.6 M–1 cm–1 ± 43.9 respectively, expressed with the 95%
confidence interval. The corresponding fit is depicted in Fig. 5a, and
the plot of the residuals against the expected value is displayed in
Fig. 5b, showing a random dispersion and an unbiased distribution
of strings (P > 0.05).
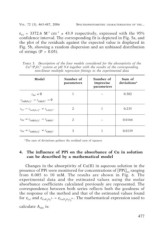
TABLE 3. Description of the four models considered for the absorptivity of the
Cu2+/P2O74– system at pH 9.4 together with the results of the corresponding
non-linear multiple regression fittings to the experimental data
Model Number of Number of Sum of
parameters imprecise deviations*
eCu' ? 0 parameters
1 0.302
–
2
e = e = 0Cu(P2O7 )26- 2
CuP2O72-
e = e ? eCu ' Cu(P2O7 )26- CuP2O72- 1 0.235
– 0.0166
e ? e = eCu' Cu(P2O7 )26-CuP2O72-
e ? e ? eCu' Cu(P2O7 )26-CuP2O72- 3 1 0.0139
*The sum of deviations gathers the residual sum of squares
4. The influence of PPi on the absorbance of Cu in solution
4. can be described by a mathematical model
Changes in the absorptivity of Cu(II) in aqueous solution in the
presence of PPi were monitored for concentrations of [PPi]tot ranging
from 0.005 to 10 mM. The results are shown in Fig. 6. The
experimental data and the estimated values using the molar
absorbance coefficients calculated previously are represented. The
correspondence between both series reflects both the goodness of
the response of the method and that of the estimated values found
for eCu’ and eCuP2O72– = e .Cu(P2O7)26– The mathematical expression used to
calculate A280 is:
477