
Page 137 - 72_03
P. 137
VOL. 72 (3), 463-487, 2006 SPECTROPHOTOMETRIC CHARACTERISATION OF THE...
Even though the [Cu]tot:[PPi]tot ratios were kept constant in the
experimental design, the ratios [Cu]’:[PPi]’:[CuP2O72–]:[Cu(P2O7)26–]
were not constant, as a further manifestation of the complexity of
the system. In order to determine values of the molar absorptivities
for each of the components of the system it was necessary to
previously estimate the individual concentrations as a function of
[Cu]tot. Since there is no simple expression representing this
dependence, the values were calculated analytically for each data, by
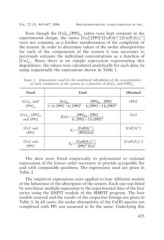
using sequentially the expressions shown in Table 1.
TABLE 1. Expressions used for the analytical calculation of the concentration
of each component of the system as a function of [Cu]tot and [PPi]tot
Fixed Used Obtained
[Cu]tot andº 1+ k1' [Cu]tot [PPi]'2 = k1' [PPi]tot - [PPi]' [PPi]’
[PPi]tot [PPi]' + k2' [PPi]' + 2 k2'[PPi]'2 [Cu]’
[CuP2O72–]
[Cu]tot, [PPi]tot [Cu]' = k1' [PPi]tot - [PPi]'
and [PPi]’ [PPi]' + 2 k2'[PPi]'2
[Cu]’ and k1' = [CuP2O72- ]
[PPi]’ [PPi]'[Cu]'
[Cu]’ and k 2' = [Cu(P2O7 )26- ] [Cu(P2O7)26–]
[PPi]’ [PPi]'2 [Cu]'
The data were fitted empirically to polynomial or rational
expressions of the lowest order necessary to provide acceptable fits
and with comparable goodness. The expressions used are given in
Table 2.
The empirical expressions were applied to four different models
of the behaviour of the absorption of the system. Each one was fitted
by non-linear multiple regression to the experimental data of the four
series using the QNFIT module of the SIMFIT program. The four
models assayed and the results of the respective fittings are given in
Table 3. In all cases, the molar absorptivity of the Cu(II) species not
complexed with PPi was assumed to be the same. Underlying this
475