
Page 156 - 72_01
P. 156
YAHYA DAHMANY Y COLS. AN. R. ACAD. NAC. FARM.
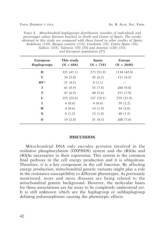
TABLE 2. Mitochondrial haplogroups distribution (number of individuals and
percentages values between bracket) in North and Centre of Spain. The results
obtained in this study are compared with those found in other studies of Spain:
Andalusia (158), Basque country (173), Catalonia (78), Centre Spain (50),
Galicia (103), Valencia (30) [34] and Asturias (126) [35];
and European population [27]
European This study Spain Europe
Haplogroups (N = 686) (N = 718) (N = 2648)
H 323 (47.1) 373 (51.9) 1134 (42.8)
V 34 (5.0) 45 (6.3) 111 (4.2)
HV* 31 (4.5) 8 (1.1) —
J 61 (8.9) 53 (7.4) 260 (9.8)
T 47 (6.9) 40 (5.6) 211 (7.9)
U 579 (21.9)
I 155 (22.6) 137 (19.1) 59 (2.2)
W 4 (0.6) 4 (0.6) 54 (2.0)
X 4 (0.6) 14 (1.9) 40 (1.5)
8 (1.2) 13 (1.8)
O 200 (7.6)
19 (2.8) 31 (4.3)
DISCUSSION
Mitochondrial DNA only encodes proteins involved in the
oxidative phosphorylation (OXPHOS) system and the tRNAs and
rRNAs necessaries to their expression. This system is the common
final pathway in the cell energy production and it is ubiquitous.
Therefore, it is a key component in the cell function. By affecting
energy production, mitochondrial genetic variants might play a role
in the resistance-susceptibility to different phenotypes. As previously
mentioned, more and more diseases are being related to the
mitochondrial genetic background. However, the molecular bases
for these associations are far away to be completely understood yet.
It is still unknown which are the haplogroup or subhaplogroup
defining polymorphisms causing the phenotypic effects.
42