
Page 157 - 72_01
P. 157
VOL. 72 (1), 37-47, 2006 MITOCHONDRIAL LINEAGES DISTRIBUTION IN THE SPANISH...
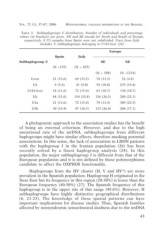
TABLE 3. Subhaplogroups U distribution. Number of individuals and percentage
values (in brackets) are given. NE and SE encode for North and South of Europe,
respectively. 8 U5 samples from Spain were not subdivided. Urest from Italy
includes U subhaplogroups belonging to U1811rest (24)
Subhaplogroup U Spain Italy Europe
(N =155) SE NE
(N = 455)
Urest 21 (13.6) (N = 588) (N =1214)
U4 9 (5.8) 69 (15.2) 78 (13.3) 52 (4.8)
41 (9.0) 59 (10.0)
U1811rest 18 (11.6) 72 (15.8) 63 (10.7) 235 (19.4)
Uk 48 (31.0) 154 (33.8) 156 (26.5) 130 (10.7)
U5a 21 (13.6) 72 (15.8) 79 (13.4) 280 (23.1)
U5b 30 (19.4) 47 (10.3) 153 (26.0) 309 (25.5)
208 (17.1)
A phylogenetic approach to the association studies has the benefit
of being an external criterium. However, and due to the high
mutational rate of the mtDNA, subhaplogroups from different
haplogroups might have similar effects, therefore masking potential
associations. In this sense, the lack of association in LHON patients
with the haplogroup J in the Iranian population (26) has been
recently solved by a finest haplogroup analysis (24). In this
population, the major subhaplogroup J is different from that of the
European population and it is not defined by those polymorphisms
candidate to affect the OXPHOS functionality.
Haplogroups from the HV cluster (H, V and HV*) are more
prevalent in the Spanish population. Haplogroup H originated in the
Near East but its frequency in this region (20-30%) is lower than the
European frequency (40-50%) (27). The Spanish frequency of this
haplogroup is in the upper site of this range (49.6%). However, H
subhaplogroups have highly distinctive geographical distributions
(6, 21-23). The knowledge of these spatial patterns can have
important implications for disease studies. Thus, Spanish families
affected by nonsyndromic sensorineural deafness due to the mtDNA
43