
Page 186 - 70_04
P. 186
MANFRED ANKE AN. R. ACAD. NAC. FARM.
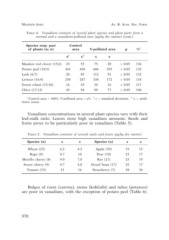
TABLE 4. Vanadium contents of several plant species and plant parts from a
normal and a vanadium-polluted area (µg/kg dry matter) (cont.)
Species resp. part Control V-polluted area p %1
of plants (n; n) area
136
s2 x3 x s 132
132
Meadow red clover (15;6) 23 55 75 20 > 0.05 118
Potato peel (18;5) 343 458 606 295 > 0.05 117
Leek (6;7) 28 85 112 91 > 0.05 104
Lettuce (16;9) 250 287 338 172 > 0.05
Green wheat (13;18) 16 29 34 16 > 0.05
Chive (17;13) 43 94 98 77 > 0.05
1 Control area = 100%, V-polluted area = x%. 2 s = standard deviation. 3 x = arith-
metic mean.
Vanadium concentrations in several plant species vary with their
leaf-stalk ratio. Leaves store high vanadium amounts. Seeds and
fruits prove to be particularly poor in vanadium (Table 5).
TABLE 5. Vanadium contents of several seeds and fruits (µg/kg dry matter)
Species (n) x s Species (n) xs
Wheat (23) 6.2 4.2 Apple (39) 19 15
Rape (8) 8.7 10 Pear (10) 23 17
9.0 7.8 Rye (21) 23 19
Morello cherry (8) 9.7 4.0 Dwarf bean (17) 25 17
Sweet cherry (9) 13 16 Strawberry (7) 38 36
Tomato (15)
Bulges of roots (carrots), stems (kohlrabi) and tubes (potatoes)
are poor in vanadium, with the exception of potato peel (Table 6).
970