
Page 71 - 77_01
P. 71
GUZMÁN--ARANGUREN
Y
COLS
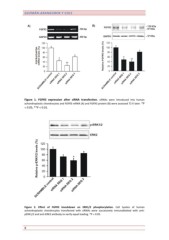
Figure
1.
FGFR3
expression
after
siRNA
transfection.
siRNAs
were
introduced
into
human
achondroplastic
chondrocytes
and
FGFR3
mRNA
(A)
and
FGFR3
protein
(B)
were
assessed
72
h
later.
*P
<
0.05,
**P
<
0.01.
Figure
2.
Effect
of
FGFR3
knockdown
on
ERK1/2
phosphorylation.
Cell
lysates
of
human
achondroplastic
chondrocytes
transfected
with
siRNAs
were
successively
inmunoblotted
with
anti--
pERK1/2
and
anti--ERK2
antibody
to
verify
equal
loading.
*P
<
0.05.
8