
Page 79 - 76_02
P. 79
VOL. 76 (2), 189-208, 2010 THE IGNORED STOWAWAYS: WORLDWIDE...
3.3. Fluctuation analysis
When conducting the fluctuation analysis, the cell density of
strain Dc1 was drastically reduced in each experimental culture due
to destruction of wild-type cells, by the toxic effect of TBT. However,
after further incubation for 60 days, some cultures increased in
density again, apparently due to growth of a TBT-resistant variant.
In the case of set 1, only some cultures recovered after 60 days
under TBT exposure (Table 1). By contrast, every set 2 culture
recovered, indicating the presence of TBT-resistant cells in all
cultures. A high fluctuation (variation) in the set 1 experiment
(from 0 to more than 105 resistant cells per culture flask) was found
(Table 1). In contrast, in set 2 controls all the culture flaks showed
from 104 to 105 TBT-resistant cells (a scarce variation due to
experimental error), which indicated that the high fluctuation found
in set 1 cultures should be due to processes other than sampling
error. The fluctuation of set 1 experiment indicates that TBT-
resistant cells arose by rare, pre-selective spontaneous mutations
rather than by specific adaptation in response to TBT.
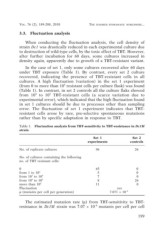
Table 1. Fluctuation analysis from TBT-sensitivity to TBT-resistance in Dc1M
strain
Set 1 Set 2
experiments controls
No. of replicate cultures 96 26
No. of cultures containing the following
no. of TBT resistant cells:
0 65 0
from 1 to 103 50
from 103 to 104 70
from 104 to 105 8 26
more than 105
11 0
Fluctuation yes
µ (mutants per cell per generation) 7.071 × 10⁻⁸
The estimated mutation rate (µ) from TBT-sensitivity to TBT-
resistance in Dc1M strain was 7.07 × 10⁻⁸ mutants per cell per cell
199