
Page 76 - 76_02
P. 76
VICTORIA LÓPEZ-RODAS Y COLS. AN. R. ACAD. NAC. FARM.
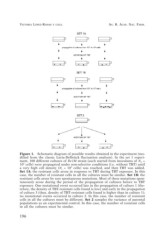
Figure 1. Schematic diagram of possible results obtained in the experiment (mo-
dified from the classic Luria-Delbrück fluctuation analysis). In the set 1 experi-
ment, 100 different cultures of Dc1M strain (each started from inoculums of N0 =
102 cells) were propagated under non-selective conditions (i.e. without TBT) until
a very high cell density (Nt = 105 cells) was reached, and then TBT was added.
Set 1A: the resistant cells arose in response to TBT during TBT exposure. In this
case, the number of resistant cells in all the cultures must be similar. Set 1B: the
resistant cells arose by rare spontaneous mutations. Most of these mutations spon-
taneously arose during the period of the propagation of cultures before to TBT
exposure. One mutational event occurred late in the propagation of culture 1 (the-
refore, the density of TBT-resistant cells found is low) and early in the propagation
of culture 3 (thus, density of TBT-resistant cells found is higher than in culture 1);
no mutational events occurred in culture 2. In this case, the number of resistant
cells in all the cultures must be different. Set 2 samples the variance of parental
populations as an experimental control. In this case, the number of resistant cells
in all the cultures must be similar.
196