
Page 115 - 76_02
P. 115
VOL. 76 (2), 223-239, 2010 PREDICTION OF LIGAND BINDING ENERGY...
properly described, so lower values of b should be required in some
cases.
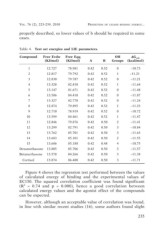
Table 4. Test set energies and LIE parameters.
Compound Free Evdw Free Eqq OH ?Gcalc
(KJ/mol) (KJ/mol)
A B Groups (kcal/mol)
1 12.727 78.981 0.42 0.52 0 –10.73
79.792 0.42 0.52 1 –11.21
2 12.817 79.787 0.42 0.52 0 –11.21
82.810 0.42 0.52 1 –11.64
3 12.830 81.671 0.42 0.52 0 –11.48
84.418 0.42 0.52 0 –11.87
4 13.328 82.770 0.42 0.52 0 –11.24
79.895 0.42 0.52 1 –11.23
5 13.147 78.919 0.42 0.52 0 –10.72
84.461 0.42 0.52 1 –11.47
6 13.586 79.876 0.42 0.50 2 –11.41
82.791 0.42 0.50 3 –10.84
7 13.327 85.701 0.42 0.50 3 –11.63
85.101 0.42 0.50 2 –11.55
8 12.874 85.188 0.42 0.48 4 –10.75
85.706 0.42 0.50 3 –11,57
9 12.710 84.266 0.42 0.50 3 –11.38
86.480 0.42 0.50 3 –11.71
10 13.599
11 12.846
12 13.299
13 13.762
14 13.683
15 13.686
Dexamethasone 13.805
Betamethasone 13.578
Cortisol 13.874
Figure 4 shows the regression test performed between the values
of calculated energy of binding and the experimental values of
EC150. The squared correlation coefficient was found significant
(R2 = 0.74 and p = 0.000), hence a good correlation between
calculated energy values and the agonist effect of the compounds
can be expected.
However, although an acceptable value of correlation was found,
in line with similar recent studies (16), some authors found slight
235